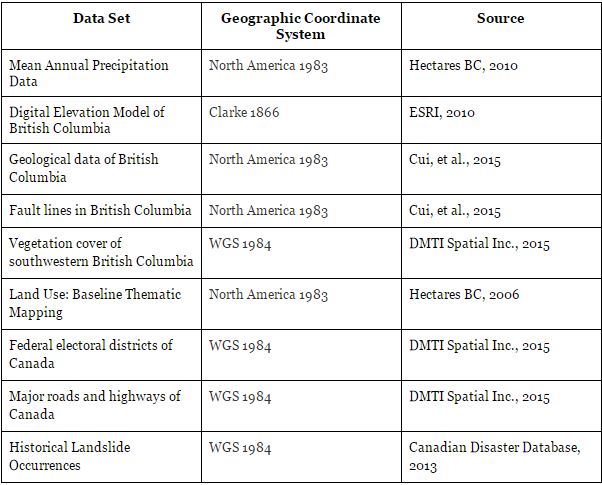
The following data sets were obtained for the analysis:

Table 1. Dataset, geographic coordinate system and source used in analysis.
Elevation, precipitation, and proximity to fault line layers were provided in raster format. The precipitation data was found to have the highest resolution of the collected data and consisted of 100 x 100 m cell sizes. In order to complete an effective evaluation of these layers, it was necessary to re-sample all other raster data to fit this cell resolution. Raster data was re-sampled using the bi-linear re-sampling technique, as this technique was suitable for continuous data, and retains cell values within the given sample size. Precipitation (HectaresBC, 2010) was converted from an ascii file to raster layer. The baseline thematic mapping downloaded from HectaresBC (2006) described detailed land use patterns, but was provided in two separate formats; a bitmap (BMP) file, and a comma separated value (CSV) file detailing the the information for the BMP file. This BMP raster layer and attribute data were joined in ArcGIS to create a combined layer.
All mapping data was projected to North America Datum 1983 (NAD83) and clipped to the electoral district for “West Vancouver- Sunshine Coast- Sea-to-Sky District” downloaded from the DMTI Spatial Inc dataset (2015) .
