On Sep 25th, Abdel Azim Zumrawi (Statistician, UBC Centre for Teaching and Learning) and Leah Macfadyen (Program director, Evaluation and Learning Analytics, UBC Faculty of Arts) spoke about challenges of meaningfully capturing, summarizing and presenting Student Evaluations of Teaching and Learning (SEoT) data at UBC.
Leah opened the session by talking about history of SEoT at UBC. The UBC Senate has been considering student evaluations ever since 1974. Then later in 2007, an updated policy, recommended by Teaching and Learning Committee, was approved by the senate that requires every course section or learning experience to be evaluated by students every time it is offered (with some exceptions). For more information visit http://teacheval.ubc.ca/.
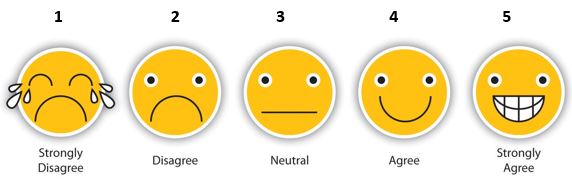
Based on this policy, a modular model is implemented at UBC, where the student evaluations questionnaire includes university-wide questions, as well as, faculty and department specific ones. Most of these questions adopt a 5-point Likert scale to measure respondents agreement. The response categories are then translated into quantitative scores. Below is a visual representation of a Likert scale.
The original SEoT data is ordinal and not ratio scale, meaning that the points are ordered along one spectrum but the distance between them is not known. This poses some challenges when summarizing and presenting SEoT data, as pointed out by Abdel Azim. For instance, using “average” to compare evaluations across individuals and units can be misleading. To demonstrate his point, Abdel Azim shared an example of 6 distributions of SEoT scores that all have the same average but clearly show very different patterns.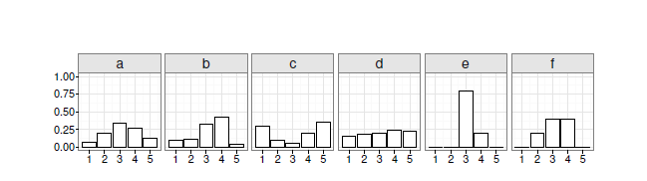
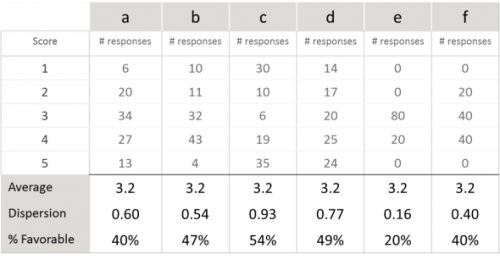
One would naturally think that a measure of variability is required to better describe and distinguish these patterns. Abdel Azim argued that “standard deviation” is not an accurate measure of variability for ordinal SEoT data. He suggests adopting a simple and intuitive “dispersion index” suited for ordinal data instead. A dispersion metric would range from 0 (complete agreement) to 1.0 (a 50-50 split between the two extreme scores).
In addition to dispersion index, Abdel Azim suggests looking at “percent of favorable responses” (i.e., those rated 4 or 5) when summarizing SEoT data. Several years of data at UBC shows that overall, students tend to give instructors higher ratings of 4 and 5. However, the percentage may differ from one course offering to another.
Revisiting the 6 distributions of SEoT data in the earlier example, Abdel Azim pointed out that while averages are exactly the same, both dispersion index and percent of favorable responses are very different per case. This signifies the necessity of adopting appropriate metrics for summarizing SEoT data.
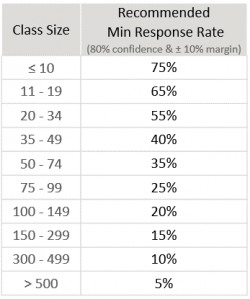
 Abdel Azim explained that “response rate” is one other factor that should be taken into account when analyzing SEoT data. Not all students in all classes choose to complete the evaluations, resulting in varying response rates. Extensive statistical analysis of UBC SEoT data has been done to determine minimum recommended response rates for generating reliable score distributions for class sizes, where scores were classified as “favorable” or “unfavorable”.
Justin Lee (Programmer Analyst, UBC’s Faculty of Land and Food Systems) closed the session by sharing his visualization work that allows users to explore SEoT data for his faculty using the above metrics in one interactive dashboard.