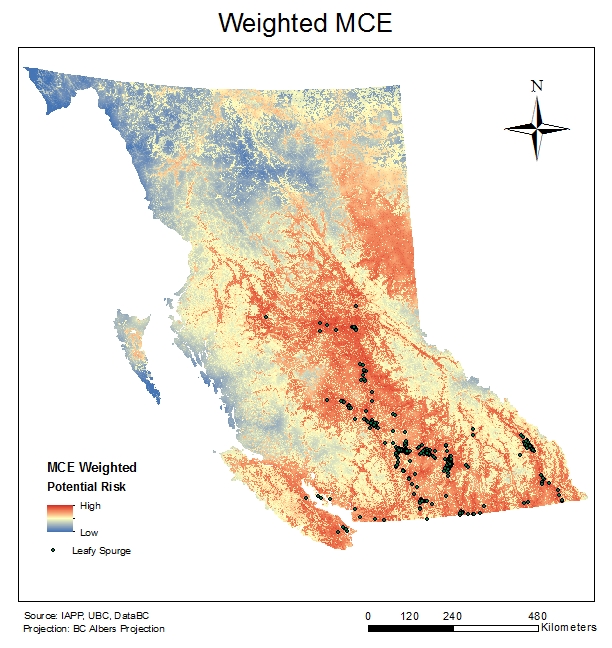
Figure 1
The results of our Multi Criteria Evaluation shows areas of high risk to Leafy Spurge invasion in red, and areas of low risk in blue. Figure 1 shows the range of invasion in BC. We can see that the high risk invasion areas are concentrated around the existing plant sites (green points). This is expected because areas of high risk should be near the source of spread (plants). Areas of high risk of plant invasion are mainly concentrated in the lower half of BC. We can see streams of red areas branching out from the interior of BC
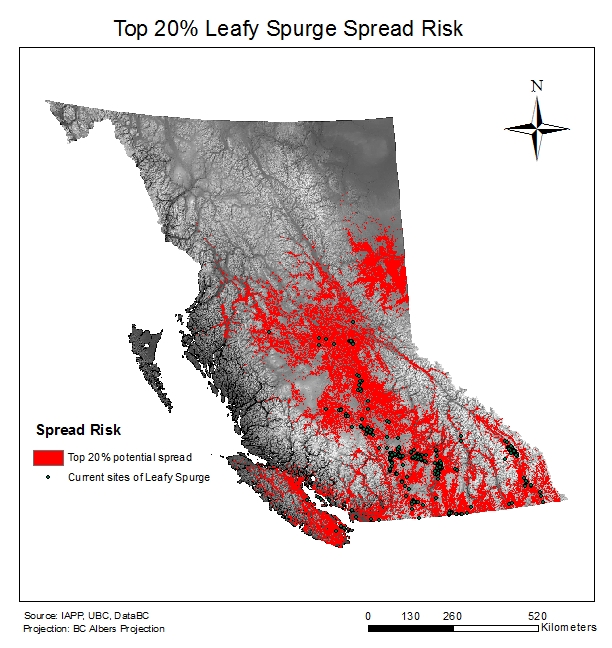
Figure 2
In Figure 2 we can see the top 20% (186,104 km2) of high risk areas. Overall there appears to be a spread in the North Eastern direction of British Columbia. There is wider spread in Central/Northern BC, despite there being less plants surveyed, while the opposite is true for Southern BC. Although there are more current plant locations in the south, there is less spread.
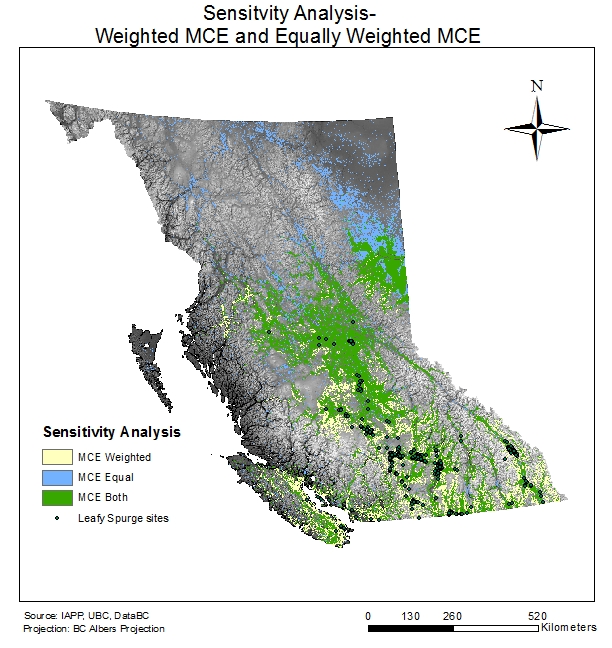
Figure 3
Figure 3 shows the sensitivity of our parameters chosen. Our equal weighed MCE (areas in light blue) showed a greater risk of invasion up north that was not shown in our original MCE model. This is likely due to our high weight assigned to existing plants in our MCE model. Despite this difference, we found 140,263km2 of land overlapped (MCE both in green). That is an overlap of 75%, indicating our model has a low sensitivity to weight changes.
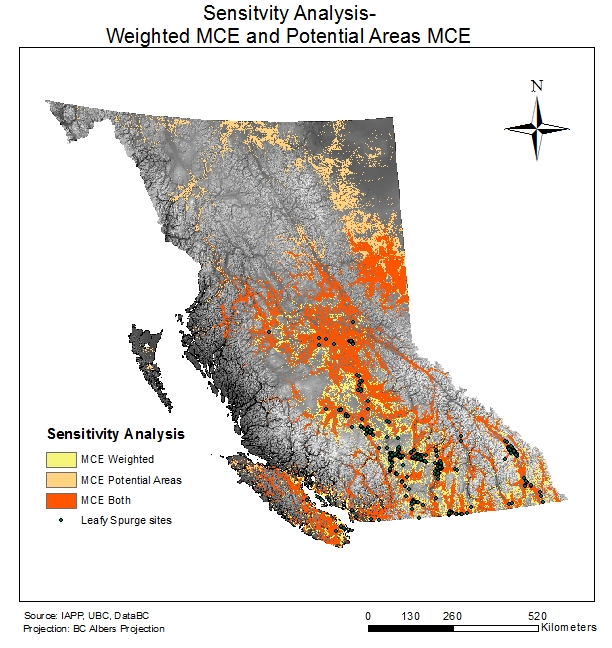
Figure 4
In our second sensitivity analysis, we were interested in seeing how sensitive our results were to current sites of leafy spurge because Figures 1 and 2 showed high risk areas located in close proximity to current leafy spurge sites. We wanted to see if our chosen criteria was appropriate for our analysis as risk should still occur at plant sites despite not including current plant data in our MCE. In figure 4, our sensitivity analysis showed that 147,034 km2 of land overlapped. This is an overlap of 79%, indicating that potential areas of plant growth corresponded with current locations.
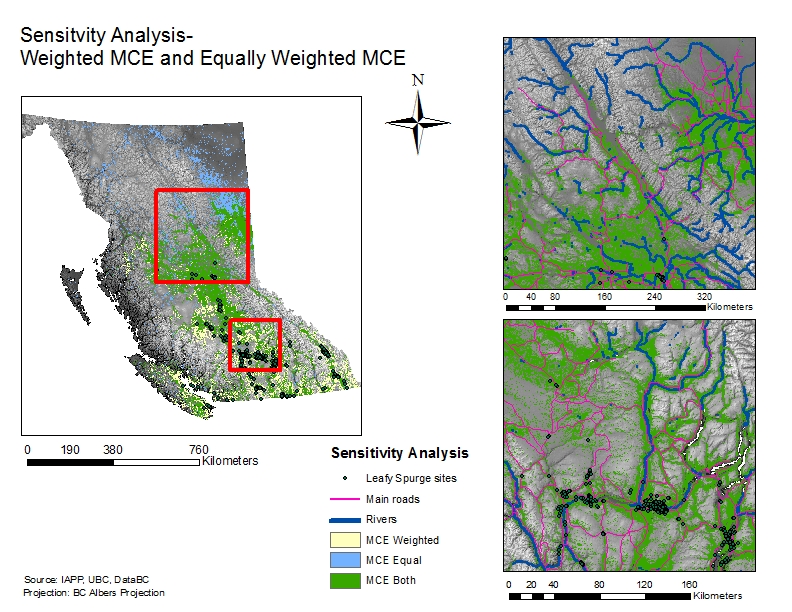
Figure 5
Figure 5 shows a closer view of two areas of interest. The upper inset map shows that the area of risk located in North-Eastern BC is not currently connected to the other areas of risk and has no current sites of leafy spurge. When we overlay main roads we can see that there is a road that connects the two areas of high risk. Although there are no recorded sites of leafy spurge in the North East part of British Columbia, there is a chance of spread to this area via the 97 Alaska Highway.
In the lower inset map, it is apparent that the high risk areas are spread along rivers and roads. We wanted to see if this observation is due to our heavier weighting of the two parameters. In Figure 5 our sensitivity analysis shows that even with equal weighting of our parameters, our results still show high risk along rivers and roads. This is supported by our research which showed that waterways and transportation routes are areas with high potential spread of Leafy Spurge.