Methodology:
Multiple-criteria evaluation (MCE) in GIS was used to determine areas in BC of highest risk to the spread of Euphorbia esula or Leafy Spurge. As this plant is difficult to remove once it has invaded an area, the goal of this MCE model is to determine high risk areas to ensure early prevention of this invasive plant.
CHOSEN CRITERIA
Factors were chosen based on literature findings about preferred habitat and different methods for seed dispersal. Current plant distribution, rivers, and roads were used to determine the potential spread of the plant. While land use, soil drainage, aspect and elevation were used to determine ideal conditions for plant growth. No constraints were chosen for our MCE.
NORMALIZATION OF FEATURES
Each factor was then normalized to a common scale of 0 -1 to allow for a fair comparison between each feature. Values closer to 1 were considered “good” and values close to 0 were undesired/poor values.
Brief summary of Normalization
| Feature of Interest | Type of FUZZY membership | |
| Land use | Linear | Min: 6 |
| Max: 1 | ||
| Soil Drainage | Near | Midpoint: 5.5 |
| Spread: 0.001 | ||
| Rivers | Linear | Min: 60,000 |
| Max: 0 | ||
| Roads | Linear | Min: 145,079 |
| Max: 0 | ||
| Aspect | Gaussian | Midpoint: 210 |
| Spread: 0.001 | ||
| Elevation | Gaussian | Midpoint: 809 |
| Spread: 0.00001 |
Determining Weights for each Factor
After normalizing each factor, weights were assigned using the analytical hierarchy process (AHP) with the website “My Choice, My Decision.” The AHP is based upon ranking features in pairs (binary comparison) resulting in a model of weights with a summation of 100%. Below is a table with the results of the AHP:
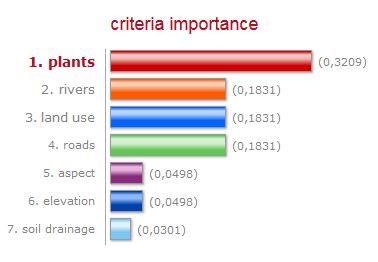
Consistency Ratio of 0.00046
Plants were given the highest weight because we wanted our MCE model to emphasize the spread based on current plant locations due to their extensive root systems being a distinct and primary method for plant spread. Rivers and roads were weighted the second highest because through our literature it was found that these two factors were common ways for plant dispersal . Land use was weighted equally as high because it was found that open and disturbed areas were an important feature for plant growth. Elevation and Aspect were given low weights. This plant is found in a wide range of elevations and while we found it prefers sunlight, there was a lack of literature on specific preference in slope direction. Soil Drainage was weighted the lowest because our plant is quite resilient and can survive in a variety of soil types. Also soil drainage was based on its Soil Moisture Regime (SMR) preference, but drainage is only one characteristic out of the many in the SMR.
Weighted Linear Overlay
Each raster layer was assigned the weighted value from the AHP combined through a raster overlay of all features. The output raster cell values were determined through a MCE Algorithm by multiplying each layer with the weight assigned and summing them.
SENSITIVITY ANALYSIS
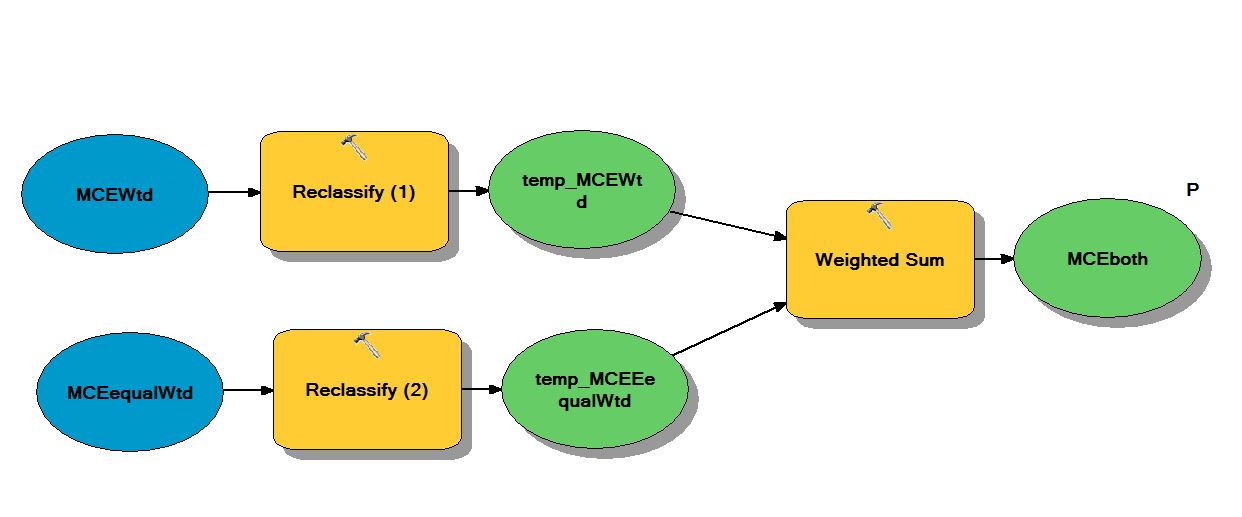
Model for Sensitivity Analysis 1
Because the weights assigned with the AHP were somewhat arbitrary, we performed a sensitivity analysis to check for any uncertainties and sensitivities in our parameters. A sensitivity analysis was performed with equal weights given to all 7 factors. Each factor was given a weight of 14.2857%. We then took the top 30% of cells in our Weighted MCE and Equally Weighted MCE and through the model above, determined areas in which both MCE models overlapped.
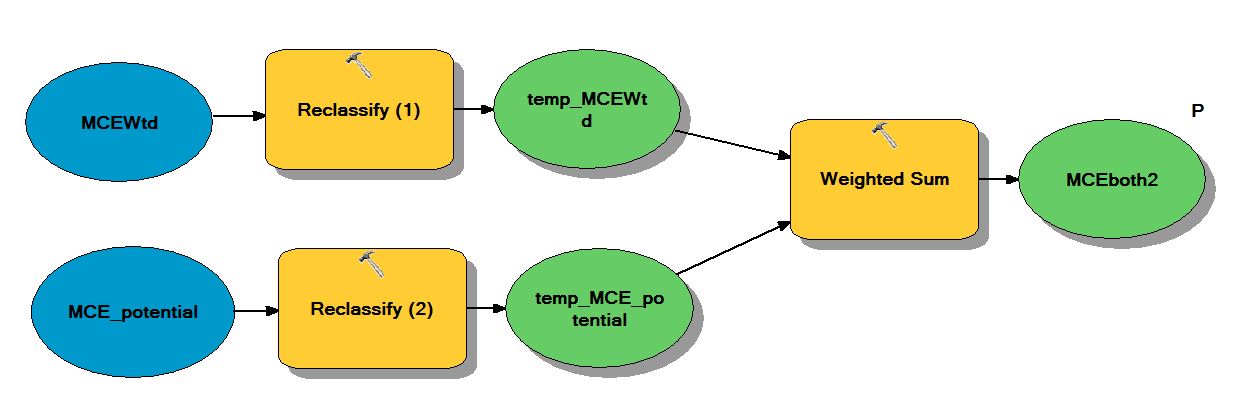
Model for Sensitivity Analysis 2
We performed a second sensitivity analysis by removing the plant layer. All other features were weighted the same relative to one another. Our second sensitivity analysis overlaid the top 30% of cells from our MCE model and the top 30% of cells from the new MCE model without the plants. This sensitivity analysis was done to show that areas of high risk will remain high risk regardless of proximity to known plants.