Tag Archives: LFSResearch

Surface Chemistry of Naturally Occurring Asbestos – understanding its potential health hazard

Imagine finding out that your home was surrounded by a nano-sized toxicant. You couldn’t see it but it was in the air all around you, and you and your family were breathing it in with every breath. This is unfortunately a reality for people living in communities where Naturally Occurring Asbestos, or NOA, exists. NOA is asbestos that occurs in the soil or geology of a region – it wasn’t put there by human activities.

Asbestos refers to a group of fibrous minerals once considered miraculous due to their suitability for over 3000 industrial purposes, such as insulation and building materials. However, these miraculous minerals also pose a severe health hazard. Asbestos inhalation is linked to lung cancer and mesothelioma, a highly fatal cancer of the chest cavity.

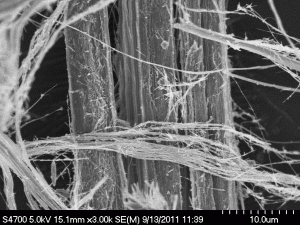
Bundles of chrysotile asbestos, 5000X

Chrysotile, the most common form of asbestos, contains oxidizing metals, such as chromium, nickel, and iron, that are linked to the negative health effects of the fibers. There have been very few studies conducted on NOA chrysotile, and the health risks remain unclear. There is currently no consensus on how hazardous NOA is, or how it should be dealt with.

Asbestos becomes less toxic when the layer containing the oxidizing metals is leached from the surface. Weathering in the natural environment may alter the surface chemistry of asbestos fibers, making them less hazardous.

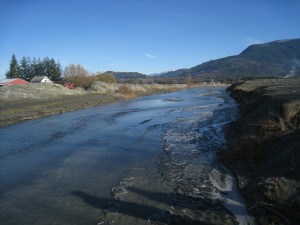
One of the communities struggling to deal with NOA is the Sumas Prairie in the Lower Fraser Valley. A landslide on Sumas mountain, WA, has been dumping asbestos rock into the Sumas river since the 1970’s. The asbestos material is carried down the river as sediment and deposited on the floodplain during flood events. When the sediment dries out, it can become airborne and pose an inhalation hazard to local residents.

The Sumas River with piles of asbestos laden sediment in front of the local homes.

For my Master’s research, I examined the surface chemistry of asbestos as it moved down the Sumas River, and before and after treatment with naturally occurring acids (oxalic, HCl, and carbonic), to determine if naturally occurring acids in soils and streams are removing the surface magnesium, and thus reducing the toxicity of the asbestos.

As the asbestos moves downstream, the surface chemistry of the asbestos fibers are altered, indicating that natural weathering is likely reducing the toxic effect of the fibers.

We may be able to speed up the rate the asbestos is detoxified by covering the asbestos contaminated floodplains with organic material. Organic material naturally forms organic acids, which over time will leach the heavy metals from the fibers. The organic matter layer will also cover the asbestos material preventing it from becoming airborne. If the fibers aren’t airborne, they won’t be inhaled by residents and thus, will not pose a health hazard.

How Failures to Acknowledge the Limits to Growth Continues to Affect Rural Poverty

Recent downturns in many so called ‘developed’ economies have more people than ever second-guessing the possibilities of exponential growth and reevaluating what risk means in an increasingly globalized world economy, but ask a smallholder farmer who’s gambled on the world export market and lost and they’ll tell you that the jig has been up for a long time, we’re just now feeling the pinch.

Remember back in 2007 when your grocery bill was increased by a few notches? I remember mostly because I was studying rural development at the time and the people around me were asking themselves at the checkout counter: “could this mean higher profits for poor smallholder farmers?”. Ok, maybe first they lamented that the days of inexpensive high-quality basmati rice were gone, but they found some comfort at least in the hope that food prices were finally making the long over due turnaround before rock-bottom. We now know though that these price increases didn’t translate to better deals for smallholders, and this fact speaks volumes to the uncompetitive and volatile markets that farmers are exposed to; a microcosm of the wider economic ills that the ‘developed’ world is reeling with at the moment.

Poor smallholders have been encouraged in a variety of ways and by a great many advocates that export markets are the modern way. Proponents for outward expansion into high-value crops claim that agricultural exports can produce faster growth than in domestic demand (World Bank, 2004), that export growth contributes to the growth of non-export agriculture by providing cash income that can be used to modernize farming practices (ibid) and that agricultural trade liberalization increases overall prosperity (Mccalla & Nash, 2007)

The precarious relationship between growth, poverty reduction and food security can be seen at a basic level by the fact that “of the world’s 34 most food insecure countries, 22 had average annual growth rates of 5 to 16 percent between 2004-2006” (von Braun, 2007). Economic growth does not cure hunger and poverty on its own.

It is important to keep in mind that trade policies, incentive programs and small scale development projects directly affect the 75% of the world’s poor who live in rural areas since the vast majority of them rely on agriculture for some part of their incomes (World Bank 2008). Whether it’s cheap imports displacing their local production systems or the removal of price support systems and marketing boards, these decisions and the forms of food marketing that are encouraged by them have direct influences on poor smallholder farmers, their families and their communities.  The global price fluctuations that make us uneasy when we glance at graphs posted on news websites can mean the difference between three healthy meals a day or malnutrition for many.

Growth, it seems, is not exponential nor is it limitless. Investors and public policy makers are now learning hard lessons about market volatility and how the bottom can fall out so easily. If they’re weary about putting their investments on the line, how can we still be asking smallholder farmers to put themselves out there?

Sources:

McCalla, A. F., & Nash, J. (2007). Agricultural Trade Reform and Developing Countries: Issues, Challenges, and Structure of the Volume. In A. F. McCalla & J. Nash (Eds.), Reforming Agricultural Trade for Developing Countries Volume 1: Key Issues for a Pro-Development Outcome of the Doha Round (pp. 1-17). Washington, D.C. The World Bank

World Bank. (2004). Global Economic Prospects: Realizing the Development Promise of the Doha Agenda. Washington, D.C.

World Bank. (2008). Agriculture and Poverty Reduction. Agriculture for Development Policy Brief.

von Braun, J.. (2007). The World Food Situation: New Driving Forces and Required Actions. Washington, D.C. International Food Policy Research Institute.

The Environmental Impact of Trade in Canada – a Brief Introduction

Trade liberalization of the agricultural sector in any country often leads to three possible production effects that can affect the environment: a scale effect, a composition effect and a technique effect. In the first case, trade liberalization allows countries to reach new markets, thus increasing the overall production scale. If the country produces goods that negatively affect the environment, then trade generates pollution through this scale effect. However, trade liberalization goes both ways – other countries will now be able to sell to the newly liberalized economy. As a result, countries will tend to specialize in goods for which they have a comparative advantage, switching their product composition to goods they can produce more efficiently. If the country specializes in “dirty” (polluting) goods, then trade generates pollution through the composition effect. Finally, as a result of trade, countries might have access to new productive technology from their counterparts, and will also have incentives to improve its own productive technologies to become more competitive. If any new technology is more polluting than those used before trade liberalization, there will be a negative environmental technique effect from trade.

Trade Liberalization and the Environment in Canada: The Crop Sector

Canada joined the World Trade organization in 1995 and has signed over 11 bilateral or multilateral trade agreements ever since. Canadian crop exports have dramatically increased ever since. Between 1988 and 1998, Canadian vegetable exports (including cereals, fruits and vegetables, oil seeds, fodder and roots) increased in 47%, and between 1998 and 2008 these increased by 102%. During this period, cereals went from representing 74% of total vegetable exports in 1988 to 46% in 1998 and 44% in 2008. In contrast, oilseeds (e.g. canola, soybeans) and vegetables/roots (e.g. beans) increased its share from 16% and 5%, respectively, in 1988 to 30% and 16% in 2008.(1)

Pollution from agricultural trade – is there a case in Canada?

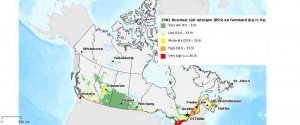
A case can be made for the need to study the environmental impact of crop trade liberalization in Canada, when contrasting exports with environmental changes. For example, most of Manitoba’s agricultural land in 1981 had very low levels of residual soil nitrogen (RSN), between zero and 9.9 kg N/ha.

1981 Residual Soil Nitrogen (RSN) on farmland, © 2010 Agriculture and Agri-Food Canada. All rights reserved.

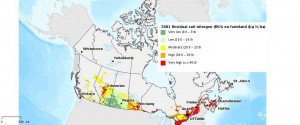
In 1991, right after signing the Canada-US Trade Agreement (CUSTA), almost all of Manitoba’s agricultural land had either moderate RSN levels (between 20 and 29.9 kg N/ha) or high (30-39.9 kg N/ha) (2). By 2001, most of its land had either high RSN levels or very high (above 40 kg N/ha).

2001 Residual Soil Nitrogen (RSN) on farmland, © 2010 Agriculture and Agri-Food Canada. All rights reserved.

Exports of highly nitrogen-demanding crops also skyrocketed in this period: between 1991 and 2006, exports of vegetables/roots/tubers (including beans) increased in 122%, and exports of oilseeds (including canola and soybeans) increased in 117% during the same period. OECD reported that, in Canada, the average nitrogen requirements of soybeans are 58 kg N/tonne of crops, and dried pulses, rapeseed (canola) and beans had an average requirement of 35 kg N/tonne(3); these are the highest nitrogen-demanding crops grown in Canada in the last 30 years.

Several other factors can influence the environmental impact of crops over soil and water. However, there seems to be a clear pattern between changes in trade patterns, production decisions (crop choices) and environmental degradation across the Canadian agricultural land, which calls for further analysis at a more disaggregated level.

(1) Statistics Canada, Canadian International Merchandise Trade Database, retrieved on April 23, 2012. http://www5.statcan.gc.ca/cimt-cicm/home-accueil?lang=eng

(2) Agriculture and Agri-Food Canada, Agri-Environmental Indicators. Retrieved on February 22, 2012.

(3) OECD Stat, Environmental Performance of Agriculture in OECD countries since 1990, retrieved on February 22, 2012.