Is the visualization able to capture the reasons behind the choices?
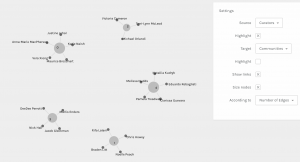
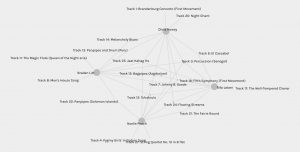
The visualization has collected participants into communities based on the similarities of their track selections, which since it is based on a numerical assignment is a quantitative data set. A limitation of this visualization is that it does not allow for a consideration of the qualitative motivations that went into the curation of the Golden Record. When examining my own placement within a community, I was grouped with 3 of my colleagues, but when reading their reflections on the motivations available on their webspace, our motivations differed greatly.
 For example, while R. Lalani (2021) used a similar motivation to my own, trying “to have some measure of geographic and racial diversity represented” for part of the curation. It quantitatively and qualitatively makes logical sense for us to share a community. In contrast, Noelle (2021) tried to “use ‘math’ to match the songs from the record to Voyager 1 and 2’s most important events while they were within our solar system”. We did not share nearly the same motivations, yet both the quantitative value of the number of edges and nodes groups us together.
The visualizations of these communities assume that we share similar mindsets and motivations, which simply is not true. The algorithm is not able to consider the qualitative aspect of the community relationship. This emphasized for me why companies, such as Google, rely so heavily on user input and interaction measurements to provide weight to certain online nodes. It is an attempt to allow the algorithm to accommodate the more ‘human’ qualitative nature of the data.
Reflect on the political implications of such groupings considering what data is missing, assumed, or misinterpreted.
An implication of these groupings that ignore the qualitative data means that groups of people with potentially minimal ideals and motivations can be brought together. There also exists some null data that easily slips through the cracks. I chose to focus on the community that I was grouped into. While examining the degree of connections and the centrality, I noticed that there were not enough nodes for how many curators and Golden Record tracks there were. For example, since no curator in my community selected Track 2 or Track 4, that data was completely disregarded as irrelevant by the algorithm.
 If weight is provided by interactions in many online algorithms, nodes that are not interacted with frequently are placed further down the hierarchy of search results. That means that the more privileged populations who can easily have Internet access see their priorities and preferences reflected in the online space, whereas those who are already at a disadvantage may have potentially beneficial nodes pushed from ‘view’ with the massive size of the network. This null data can potentially serve to reproduce and perpetuate inequalities that already exist.
References
Lalani, R. (2021, October 31). Task 8: Golden record curation. UBC. https://blogs.ubc.ca/rlalani540/2021/10/31/task-8-golden-record-curation/
Peach, N. (2021, October 30). Task 8: Curating the golden record. UBC. https://blogs.ubc.ca/peach524/2021/10/30/task-8-curating-the-golden-record/