REDUCING TRAFFIC CONGESTION IN LOS ANGELES

I have been to Los Angeles last year. It is an amazing western city with enjoyable sunshine. Besides the wonderful scenery, the traffic in Los Angeles also impressed me deeply. The first impression Los Angeles gave me was the severe traffic jam. When I arrived in Los Angeles, we spent nearly one hour on a normally twenty-minute drive to get the hotel from the airport. In the following days, we wasted much time on the traffic as well. We often suffered from serious delay than the prediction of the GPS especially in rush hours. Fortunately, there were a significant amount of freeways in urban area, even if the movement was slow in peak hour. But if not, I guessed things might be worse than the current situation.

Graph 1. Highway traffic in Los Angeles

As the second-most populous city in the United States, Los Angeles is facing severe problems of traffic congestion. According to the U.S. annual traffic statistics for metropolitan areas published by Texas Transportation Institute, for both total and per peak-period traveler, the congestion delays in greater Los Angeles region ranks first among the United States.

Why does L.A. face severe traffic congestion?

Traffic congestion is not a new phenomenon in urban area. The traffic congestion, in short, results from an imbalance between the demand for driving and the supply of road capacity. Equivalently, the traffic congestion is the solution to the
problem of imbalance. Although the transportation networks develop significantly over the past decades, the growth in automobile use has far exceed the road expansion. Graph 2 shows an aggregate view of this trend, comparing growth in road lane miles, population, the economy as measured by gross domestic product (GDP), and vehicle-mile traveled (VMT) in the United States since1970. The wedge between the supply and demand is likely to widen in the following years.


Graph 2. Growth in lane miles, population, GDP and VMT for the United States

The population density growth and economic expansion in Los Angeles are the essential reasons for the increase in usage of vehicles. On the one hand, more people can afford the expenditure for the vehicle by higher income. On the other hand, from an economic perspective, automotive travel is underpriced.

Firstly, the drivers are not forced to pay for the external costs created by driving the vehicles. Such external costs include environmental and social costs, such as harmful emissions and additional congestion delays for other travelers. This deficiency makes the total costs exceed the total benefits. In theoretical terms, this reduces social welfare. In practical terms, it leads to greater traffic congestion and contributes to environmental problems, such as poor air quality and additional greenhouse-gas emissions.

Secondly, the gas tax is less effective because of the development of the fuel-efficient cars. California’s gas tax has increase about 160 percent since 1970. However, in the same period, the Consumer Price Index has increased about 400 percent, while average vehicle fuel economy has increased by about 65 percent. As a result, Los Angeles now collects far less real revenue per mile of vehicle travel than before. In other words, gas tax no longer buys what it used to, and this severely restricts the ability to build new roads.

Thirdly, no direct charge for using the road and cheap parking fees are also helpless for mitigating the traffic congestion. Overall, because driving is underpriced, society tends to consume road space excessively.


Besides the above motivations, there are also another two main reasons which cause the traffic congestion in Los Angeles. One is that the public transportation system is not convenient and cost-effective enough to alternate private cars. When I was in Los Angeles, I noticed that all my friends there chose to drive cars by themselves no matter they go to school or work. They said it was more convenient and the monthly expenditure was not much higher than choosing the public transport. Another important motivation for them to choose private cars was the safety. The freight traffic in region also rise the severity of the traffic congestion.

Strategies in reducing traffic congestions

The most direct and simple method is willing to build or expand more roads to accommodate additional vehicle travel. Setting aside policy concerns related to greenhouse gas emissions and energy security, the prospects are limited. To begin with, there simply isn’t much space to build new roads in Los Angeles, especially in the urban areas with high population density. As shown in Graph 3, the density of the road network in the greater Los Angeles region, measured in lane miles per square mile, is already far greater than in any other large metropolitan area in the country.

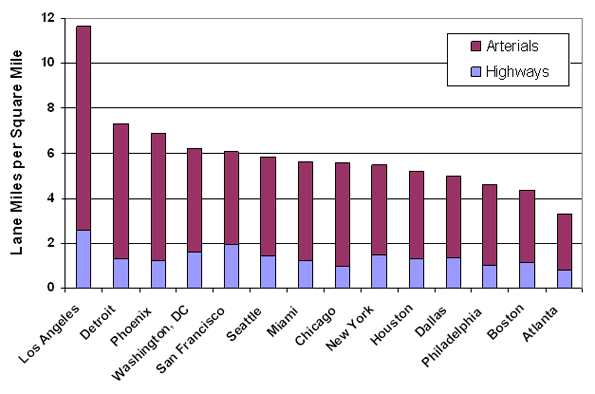
Graph 3. Road Network Density in Major Metropolitan Areas

To improve the traffic condition, there are four basic methods to use.

  1. Manage peak-hour automotive travel
  2. Raise transportation revenue
  3. Improve alternative transportation options
  4. Use existing capacity more efficiently

A phenomenon described as triple convergence undermines the effectiveness of many congestion-reduction strategies. When traffic conditions on a roadway are improved during peak hours, additional travelers will tend to converge on that newly freed capacity from (1) other times of travel, (2) other routes of travel, or (3) other modes of travel, slowly eroding the initial peak-hour congestion-reduction benefits in the busiest travel corridors.

Due to this phenomenon, pricing strategies are the most sustainable way to manage the demand for peak-hour automotive travel. The pricing strategies are often called Congestion Pricing. Specifically, it charges higher tolls to drive during peak hours or charges higher prices to park in the most convenient curb spaces at the busiest times of day. The Pricing strategies can also raise revenue to support the improvements of indispensable transportation and enhance the output capacity of existing facilities.

Graph 5. Example of Toll Roads

According to the analysis of the reasons causing the traffic congestion, significant improvements in alternative transportation modes will also be beneficial. Certain forms of pricing strategies may produce concerns about the ability of lower-income drivers to pay the charges. As the higher tolls and higher parking fees carried out, it is necessary to provide faster, more convenient and more cost-effective alternative traffic modes comparing to driving private vehicles. The improvement will also benefit those in the region who already travel by modes other than the automobile and encourage more people to choose the alternatives such as public transit.

Conclusion and Suggestion

With increasingly fuel-efficient cars, gas taxes are an ineffective way to pay for roads. Building more roads are also not a good idea to solve the problem of traffic congestion. Pricing strategies offer the only realistic prospects for managing peak-hour travel demand in L.A and there are also other additional strategies to help improve the traffic condition based on that four essential rules, such as expanding bus rapid transit with bus-only lanes or improving signal timing.

References

[1] Paul Sorensen, Martin Wachs, Endy Y. Min, Moving Los Angeles: Short-Term Policy Options for Improving Transportation. Available online at http://www.rand.org/pubs/monographs/MG748.html

[2] Paul Sorensen, Reducing Traffic Congestion and Improving Travel Options in Los Angeles, August 2010. Available online at http://www.newgeography.com/content/001318-reducing-traffic-congestion-and-improving-travel-options-los-angeles

[3] Randal O’Toole, Solving the Problem of Traffic Congestion, August, 2012. Available online at http://www.ncpa.org/pub/ba773

[4] Traffic Congestion and Reliability: Trends and Advanced Strategies for Congestion Mitigation, June, 2005. Available online at http://www.ops.fhwa.dot.gov/congestion_report/chapter3.htm


U.S. CATCH SHARE PROGRAMS

Concerns for Fishery Resources

At present, the United States gives its fishing industry the 200 nautical miles exclusive economic zone off the coast with special fishing rights. This area covers 11.4 million square kilometers which is the largest zone in the world, even exceeding the land area of the United States. The large fishing area makes the United States the fifth leading producer of fish after China, Peru, India and Indonesia, with 3.8 percent of the world total.

Historically, the fisheries developed as each area was settled. Tracing back to 1871, Congress wrote that “… the most valuable food fishes of the coast and the lakes of the U.S. are rapidly diminishing in number, to the public injury, and so as materially to affect the interests of trade and commerce….”

Based on the long history and the large scale of fishing industry in the United States, the sustainability of fishery resources has been a long-standing concern. However, the federal government did not begin actively managing fisheries until the Magnuson–Stevens Fishery Conservation and Management Act (MSA) established in 1976. The Magnuson–Stevens Act is the primary law governing marine fisheries management in United States federal waters.

Obviously, the U.S. Catch Share Programs are authorized under the Magnuson–Stevens Act.

The Catch Share Programs

As defined, catch share programs are “…a fishery management tool that dedicates a secure share of quota allowing individual fishermen, fishing cooperatives, fishing communities or other entities to harvest a fixed amount of fish.” Actually, it is a general term including many specific programs such as “Individual Transferable Quota (ITQs)” programs, “Individual Fishing Quota (IFQ)” programs, “Limited Access Privilege Program” programs, and other exclusive allocation measures such as “Territorial Use Rights Fisheries (TURFs)”.

Catch share programs have been used in U.S. federal fisheries since 1990 and now include 15 different programs currently in operation (see Table 1) from Alaska to Florida managed by six different Councils. Because of the different regions and different councils, I infer that the program design might varies widely and reflects unique fishery characteristics and program objectives. However, after looking through all the 15 programs I find that most of the catch share programs have several objectives in common. The most frequent program objectives can be concluded to be meeting conservation requirements, improving economic efficiency and flexibility, reducing excess capacity, and improving safety at sea.


Table 1.  U.S. Catch Share Programs by Fishery Management Council


The catch share programs have a more than 20-years history which cover the main regions of American fishing industry including Mid-Atlantic, New England and North pacific, etc. From the list we can find that most of the specific programs basically focus on one category. In my opinion, this kind of set may help achieve the annual catch limits more effectively to eliminate overfishing and reduce the negative biological and economic impacts of the race for fish.

To understand the catch share programs better, I would like to choose one specific program as an example and analyze it in the rest of the blog to present the mechanism and the effects of the programs.

The following graph shows the timeline and the distribution of the programs (see Graph 1). I decide to choose Northeast General Category Atlantic Sea Scallop IFQ from 2010 in New England region.

Graph 1. Timeline and Distribution of Catch Share Programs

Work Mechanism of GCASS IFQ

GCASS IFQ refers to General Category Atlantic Sea Scallop Individual Fishing Quota. The Atlantic sea scallop (see Graph 2) is one of the most valuable fisheries in the United States.  The primary range for the Atlantic sea scallop fishery is landed in New England and Mid-Atlantic ports. The General Category Scallop fishery was historically an open access fishery, allowing smaller vessels to harvest up to 400 pounds of Atlantic sea scallops. While the scallop fishery was not overfished or experiencing overfishing, there were concerns of overcapacity. In 2007, the New England Fishery Management Council proposed that the limited access fleet received 95% and the General Category Scallop Individual Fishing Quota (IFQ) fleet received 5% of total quota.

Graph 2. Atlantic Sea Scallop


As we all know, the purpose of quota share caps is to prevent individual shareholders from controlling production, as well as to achieve management objectives. The IFQ Program is subject to an ownership cap set at no more than 2.5% for any one vessel and 5% for any one individual. In the event that a single entity (an individual owner or ownership group) owns more than one vessel, the entity may not hold more than 5% of the total allocation. Allocations may be transferred on a permanent basis or transferred on an annual basis to another IFQ allocation holder, provided the ownership caps are maintained.

The effects of GCASS IFQ

There are two clear objectives of the Scallop IFQ Program. The first one is to control capacity and mortality in the general category scallop fishery. The second one is to allow for better timely integration of sea scallop assessment results in management.

In the first year of IFQ Program, implementation of the general category quota was set at 2.6 million (5% of the total scallop quota) pounds of scallop meats. The general category scallop fleet landed 4.1 million pounds of scallop meats during the Baseline Period[1]. Almost 2.3 million pounds, or 89% of the quota was utilized in 2010 (see Graph 3).

 Graph 3


Capacity, as measured by active vessels decreased by almost one-half in 2010 when compared to the Baseline Period. In 2011, the number of entities holding quota share decreased by 12% and the number of active vessels decreased by 4% in 2011.

Economic benefits, as measured by scallop revenue, and average prices have increased under the IFQ Program. Despite scallop landings decreasing 43% in 2010 relative to the Baseline Period, revenue only decreased by 24%. This was in part due to higher prices. However, in 2011, landings of scallops increased by 26% and revenue increased by 50% relative to the previous year. Ex-vessel prices for scallops increased from $6.52 in the Baseline Period to $8.78 per pound in 2010 and to $10.40 in 2011, a 60% increase in average price since the Program began.

Economic efficiency, as measured by revenue per vessel, has been steadily increasing since implementation of the IFQ Program. Revenue per vessel increased by 31% to $127,000 in 2010 when compared to the Baseline Period* and increased by 55% in 2011 relative to 2010.

Total revenue from scallop trips and non-scallop trips was $50 million during the Baseline Period. Total revenue increased by 23% to $62 million in 2010 and by another 33% to $83 million in 2011.

Revenue Distribution, as measured by the Gini coefficient which measures the distribution of revenue among entities holding shares in the Scallop IFQ Program. The Gini coefficient for the General Category Scallop IFQ Program increased from 0.51 in the Baseline Period* to 0.55 in 2010 and decreased to 0.53 in 2011.

Conclusion

Overall, these programs were successful in having fishermen observe quota limits, improving overall economic benefits and efficiency, and ending the race to fish, thereby reducing pressure on fishermen to fish during unsafe conditions. Catch share programs have also been effective in reducing fishing capacity. However, catch share programs have had distributional consequences as reductions in the number of active vessels may have been counterbalanced by reductions in the number of shareholders.


References

[1] Ayeisha A. Brinson and Eric M. The Economic Performance of U.S. Catch Share Programs. U.S. Department of Commerce, August 2013

[2] NOAA Catch Share Performance Indicator Series, 2013

[3] United Nations Convention on the Law of the Sea – Part V

[4] NOAA CATCH SHARE POLICY. National Oceanic and Atmospheric Administration. 2010.


[1] Baseline Period refers to average of three years prior to General Category Scallop IFQ implementation (2007 – 2009).

California Low-carbon Fuel Standard

Environmental protection is an eternal topic. Global warming caused by carbon emissions is changing our economy, health and communities in diverse ways. One third of the greenhouse gas emissions in the US are from Traffic. Especially in California, this rate reaches up to around 40%. Obviously, the speed of California traffic greenhouse gas emissions increased faster than the population growth which become the main source of environmental problems. In these circumstances, the Low-carbon Fuel Standard (LCFS) were released to fight global warming by reducing the amount of carbon emitted when transportation fuels are used. Adopted in 2007, California’s Low Carbon Fuel Standard requires a 10 percent reduction in the carbon intensity of transportation fuels by 2020, as measured on a lifecycle basis. The goals of the program are to reduce greenhouse gas emissions from the transportation sector, diversify the transportation fuels sector, and to spur investment and innovation in lower carbon fuels. Under the LCFS, fuel providers would be required to measure the impact of their products on global warming on a per-unit basis and reduce this impact.  There is no doubt that this standard can stimulate improvements in transportation-fuel technologies, and it can be a good template for other states and other countries to imitate.

Background

California contributes 7.5% of the total greenhouse gas (GHG) emissions in the USA, or 1.8% of global GHG emissions. In 2005, Governor’s Executive Order S-3-05 required that California reduce GHG emissions to 1990 levels by 2020 and to 80% below 1990 levels by 2050.

As it mentioned above, the goal of the standard is measured on a lifecycle basis. The lifecycle includes two parts of the total fuel cycle. Here, the term WTW which represents the “well-to-wheels” are used to discuss the total life cycle emissions for a vehicle-fuel combination including the fuel production, processing and transportation and the vehicles.

Goals

The design of the Low Carbon Fuel Standard (LCFS) should therefore respond to the following goals:

1. Encourage investment and improvement in current and near-term technologies that will help meet the 2020 goal

2.  Stimulate innovation and development of new technologies that can dramatically lower GHG emissions at low costs and can start to be deployed by 2020 or soon thereafter, creating the conditions for meeting the later 2050 goal

3.  Contribute to attainment of related objectives as much as possible, including economic growth, air quality and other environmental protection goals, affordable energy prices, environmental justice, and diverse and reliable energy sources.

Work Mechanism

The Low-carbon Fuel Standard requires producers of petroleum-based fuels to reduce the carbon intensity of their products, beginning with a quarter of a percent in 2011 culminating in a 10 percent total reduction in 2020. Petroleum importers, refiners and wholesalers can either develop their own low carbon fuel products, or buy LCFS Credits from other companies that develop and sell low carbon alternative fuels, such as biofuels, electricity, natural gas or hydrogen.

The LCFS has several principal elements. First, it establishes a life cycle-scale assessment of the carbon content for each fuel used in the LCFS. This method captures the energy used to create each fuel from the initial point of extraction or cultivation, to transport, to refining, to distribution to the final point of sale.

Second, the LCFS establishes an implementation schedule. 2010 was a reporting year, while 2011 was the first year of formal implementation where petroleum fuel producers and importers had to reduce the carbon content of their fuel by a quarter of a percent. The reduction requirements will increase steadily to the full 10% reduction in 2020.

The LCFS program also has a registry of alternative fuel producers who have submitted all appropriate documentation and are eligible to participate in the LCFS Credit Market and sell or trade credits for their low carbon alternative fuel products.

Implementation Status

The Low Carbon Fuel Standard sets declining annual targets, starting slowly with a 0.25% reduction in 2011 and increasing to 10% reduction by 2020.

In 2012, low carbon fuels displaced roughly 1.06 billion gallons of gasoline and 45 million gasoline gallon equivalents of diesel (representing 6.2% of total gasoline and diesel fuel) at average carbon intensities of 84.95g CO2e/MJ and 58.34g CO2e/MJ respectively.

By the end of 2012, the program recorded net excess credits of 1.285 million metric tons (MMT) of CO2e. This bank of excess credits represents about half of that needed to meet the 2013 LCFS obligation, though some of these credits may be required to offset deficits created from use of higher carbon petroleum fuels in 2011 and 2012.

LCFS credit prices reported to the California Air Resources Board (ARB) averaged about $13.50/MT CO2e in 2012 and $27.70 for the first two months of 2013.

Credit prices increased to over $35 between mid-January and late February 2013, according to Oil Petroleum Information Service (OPIS) and Argus Media (Argus) reports.

Since implementation, regulated parties have responded to the LCFS by lowering the CI of the California fuel pool. Continued LCFS compliance will require continued CI reductions.

Impacts

The Low-carbon Fuel Standard in California is the first standard to reduce the carbon emission in transportation sector in US. It has been presented as a model to establish a national low-carbon fuel standards at the federal level.

The low carbon fuel standard differs significantly from President Bush’s proposal to indiscriminately expand “alternative fuels” without paying attention to their environmental consequences. Instead of bringing coal-based liquid fuels and more of today’s corn-based ethanol in Bush’s proposal, the LCFS has incentives and rules needed to transform these technologies so that they can compete in energy markets that take climate change seriously.

It will take time to solve the climate change and oil import problems because the cars last for many years and the energy supply system also changes slowly.  If it successes in 2020, the new low carbon fuel standard will give the agricultural, energy and automotive industries incentives to lower the carbon intensity of today’s fuels and begin to develop the next generation of truly low-carbon fuels and vehicles

References

[1] Alexander E. Farrell, Daniel Sperling. A Low-Carbon Fuel Standard for California Part 1: Technical Analysis. Davis, CA, Institute of Transportation, August 1, 2007

[2] Alexander E. Farrell, Daniel Sperling. A Low-Carbon Fuel Standard for California Part 2: Policy Analysis.  Davis, CA, Institute of Transportation, August 1, 2007

[3] Elizabeth Burton, Niall Mateer, John Beyer. California’s Policy Approach to Develop Carbon Capture, Utilization and Sequestration as a Mitigation Technology. Energy Procedia, 2012. Available from www.sciencedirect.com

[4] Tiax LLC. Full Fuel Cycle Assessment: Well-to-Wheels Energy Inputs, Emissions, and Water Impacts. California Energy Commission, CEC-600-2007-004-REV, August 1, 2007

[5] ICF International, California’s Low Carbon Fuel Standard: Compliance Outlook for 2020. CalETC, June, 2013

[6] News Release. UC experts detail new standard for cleaner transportation fuels. Berkeley, CA, August 2, 2007. Available from http://www.energy.ca.gov/low_carbon_fuel_standard/

[7] Sonia Yeh, Julie Witcover, Jeff Kessler. Status Review of California’s Low Carbon Fuel Standard. Research Report – UCD-ITS-RR-13-06, Davis, CA, Institute of Transportation, 2013

[8] Low Carbon Fuel Standard. Fuels and Transportation Division Emerging Fuels and Technologies Office, Available from http://www.energy.ca.gov/low_carbon_fuel_standard/ ; accessed on March 10, 2014

Final Trade,Great Experience

How time flies! I have been in Vancouver for 3 months exactly and I have already finished half of the study tasks for the first term in Vancouver’s beautiful autumn. As I finished my last transaction on Friday morning, the futures trading game also comes to the final.

Thanks for Mark’s comments which encouraged me to insist on my own rule to trade. He said, finding out what you are good at and sticking to that for best results. I finally find that wheat is my best friend and it can always be in control while others are often change in a way different from what was expected. 

So I shorted 15 contracts of Dec. wheat in the final order this morning. The open price is $6.97 and it rise to $7.02 in the early morning. But the general price action for wheat today showed a downward trend. In fact, when I waked up and analyzed the trend, the wheat has experienced 2 waves of continuous decline. But I thought I did not miss this wave actually. Luckily, my forecast turned out to be CORRECT !!!


In this 6-week trading game, I learnt a lot. From knowing the definitions and rules of futures to figuring out the “short-term trading” strategy which fits for myself, it is great gains. In the end of the blogs, I summarized a series of detail strategies and lessons learnt for my futures trading journey.

a)      POSITIVE ATTITUDE AND A STRONG HEART

We must overcome one of the human failing —— Greedy. To get the meager profit is the core of this kind of strategy. The game trained me to be more resolute and broad-minded when facing the profit and loss.

b)      CHOOSE YOUR MOST FAMILIAR COMMODITY   

You can rarely get profit from the unfamiliar items. Keep an eye on the things which you are really good at, no matter in the futures trading or in your life.

c)       BUILD YOUR OWN TRADE TIME STRUCTURE

Use the 5- minute chart to make a short-term decision. After you open the position, you need to take actions in 3-4 price movement. Do not take any actions in the first 30 minutes after opening.

d)      RISK CONTROL

How well can you use the limit and stop order? It is a criteria to evaluate a good risk control trader.

e)      HAVE A QUALIFIED TRADE RECORD

Save minute chart and the daily transaction records, and then make transactions conclusion. It is an important part of the trading.

……

It was actually a precious experience for my following investment decision making in the “future”. (*^_^*)

Looking forward to the Halloween week~~

Deeper cognition about Short-term Trading

This week I insisted on my short-term trading strategy and get some deeper cognition.

Last week retrospect

I suffered from a great loss for 2 reasons last week. All of them derived from the right trend predictions but wrong trades.

1)      Wheat

I anticipated a downward trend of wheat price and I shorted 10 contracts of wheat on $6.93. After 3 price movement I got an acceptable return. According to my lessons learnt last week, I rejected my “voracity” and placed an order to cover on $6.90. Unfortunately, it was Friday afternoon and the transaction stopped soon. The delayed transaction on $6.96 in the next Monday morning made me suffer a loss of $1750. This short-term transaction asserted a failure.

2)      Feeder Cattle

It is actually a new kind of commodity to trade for me. I also estimated the price trend correctly but I placed the wrong order. It was a funny but sad story. I predicted the trend with the chart of Nov.13 feeder cattle contracts but I bought the Oct.13 feeder cattle contracts. (T_T) That made me suffer a $2325 loss.


This experience confirmed the strategy I mentioned in the blog’s lessons learnt part. “Choose my own best understanding and familiar commodities to trade.”

Do not try to catch up with the missed market

Wheat showed an amazing price movement these 2 days and I again missed this wave of market till the afternoon on Friday. The price of wheat (Dec.13) reached the highest since July. But the news shows that this price trend may not continue for long. As a short-term trader, once I miss the market, I cannot purchase it.

Highest price of Dec.13 Wheat since July

According to the trend, I cannot catch up with this wave of market which I missed.

There are some useful news link about the wheat.

http://www.bloomberg.com/news/2013-10-18/wheat-bears-prevail-as-demand-slows-for-record-crop-commodities.html

http://www.bloomberg.com/news/2013-10-17/australian-index-futures-climb-as-yen-gold-hold-advances.html

Risk and strategy of short-term trade

Short-term trading helps investors to cultivate a keen sense of market trends so that we face daily challenges of the market without the burden, and thus maintain a good attitude. Of course, there are also short-term trading obvious defect, which is mentioned below.

On the one hand, once a commodity price trends established, the anticipated price movement in one direction will be a great distance after the formation. Short-term traders could have earned the profit by the fixed positions easily, but they have to divide the profit into a profitable short return. Thereby these kind of transaction greatly reduce the earnings rates as well as increasing the risk.

On the other hand, when one-sided market trends occurs, in order to prevent traders from large losses in case of the sudden price change by a wide margin, traders should not place orders only by short-term contrarian indicator.

How to play the advantages of short-term trading while overcome its inherent flaws should become the main issue to consider to be a good short-term investor. In my opinion, this is actually a problem of identifying the market trend and use a mixture strategy of trading. Long position fits for the clear trend in one direction; short-term trading might be a better mode of operation when the trend is not obvious to predict.

Look forward to next week trades based on these strategies.~

Short-term trading attempt with a STRONG HEART

As I mentioned in my last week blog, I planned to change my strategies to handle the trading game. Yes! It is short-term trading which I need to focus on the “Meager Profit”.

Many a little makes a mickle                                       

A Strong Heart is the priority to trading the futures with a short-term strategy. We must overcome one of the “human failing” —-Voracity. To get the meager profit is the core of this kind of strategy. That is to say, a successful short-term trader wins in Quantity with a certain percentage of quality. So keep that in mind and then we have chance to get profit from short-term trading.

Actually, this week’s attempt seems not as good as I expected. The leading cause is that I cannot control the transaction time well and a desire to earn more in a single transaction.


In order to overcome the voracity, I plan to set a specific objective in every single transaction.

Intuition goes first~

If you are a short-term trader, market and policy analysis is not the most important factor, but intuition is.  Market and policy analysis fits for the long-term investment as the short-term traders need to know how to “follow the trend”. If the market runs as we expect, just follow the trend. If not, stop as soon as possible! We cannot wait passively to open position after the market proves that my anticipation is right. It might be less profitable. We also will suffer from a great loss if we wait for the market confirmation to close a position.

Saturdays’ lab seems useful for me to predict the trend to make a short-term trade. Just follow my intuition with the help of the 5-15min trend chart to make a decision.

Lessons Learnt

1.Choose my own best understanding and familiar varieties. This week I tried feeder cattle for 3 contracts. And then I found that Wheat is actually my best friend~

2.When I miss a market wave, don’t chase it! I missed a good wave today because of a nap. I felt depressed but it was the true time to test my Strong Heart~

3.Save minute chart and the daily transaction records, and then make transactions conclusion. It is an important part of the trading.

New resources:

I noticed a analysis index today which fits for short-term trading. It is RSI—-Relative Strength Index.

Just share a link on Youtube about RSI https://www.youtube.com/watch?v=LT2LpZ_TWrc

Maybe we can talk about the details next week if I find that it is useful.

Happy Thanksgiving!!


Short-term trading with Meager Profit

Strategy of next week–  Short-term trading

The market is always fluctuating in disorder. When the traders make directional selection of buying and selling, they do not depend on the judgment of long-term trend, but on their own price expectations for next wave. Short-term speculators always earn a volatile profit in a trading day, definitely without overnight positions. The short-term traders need to stop out immediately when suffering from losses. The loss of every single transaction should be kept in one price movement. We must distinguish strictly between the short-term speculation and the general investment.

We aim to earn the meager profit in short-term trading. So never be hesitate to cover the position.

The traditional trend traders have enough time to study the market, they can make use of a variety of market planning and risk control means. But for short-term traders, we do not have much time to think.

Points:

1)  Selecting the direction of trade is the key to success. In other words, make it clear whether this market is a bull market or a bear market. Only by grasping the direction of the market, we will be more likely to make money.

2)  Good grasp of the stop.
Even if you have no trading experience, you can control the risks by control the stop.

Staying Defensive for week 2

My Portfolio summary

Last week my portfolio value is $97174.32 with a negative profit. But this week I achieved a changeover. My portfolio value ends at $101,215.42 with a 1.22% return. Staying defensive is my main strategy for this week because of the uncertainty of the market.


After a long watching and analysis, I made some trades at the end of this week.

Market analysis for this week

Wheat

Wheat prices rose Friday for a fifth-straight day, as traders focused on the unfavorable weather impacting crop.

The price of December wheat rose 4.75 cents, or 0.7 percent, to $6.83 a bushel. Wheat prices are at their highest level since mid-July. The last time wheat prices rose five-straight days was early March.

I bought wheat last week and keep it to get profit this week. It contributed to my total value to balance the loss on the other two commodities. At the end of this week, I stop buy more wheat at the price $6.38.

Corn

The analysis about corn seems wrong by this week. December corn prices fell 2.75 cents, or 0.6 percent, to $4.54 a bushel. I thought it is at the low price for these few months, but I got some information that the price may still drop for a few days. So I did nothing on corn and keep watching.

Soybeans

According to the weather condition and the rising yield of soybeans. Many people who shout the soybeans this week suffer a loss. But I think the influence will continue to have an impact on the price of soybeans. I short 10 units of soybeans for the next week.

Points 

portfolio investment is really important.

Everything Will Be Better

The trading game gives me a chance to operate the funding like a real investor. I have participated in a trading game which was limited to the stock exchanges during my undergraduate study. But futures, which is different from the stock, is a totally fresh field for me.

OBJECTIVES

The trading game will last for more than 6 weeks, and I have $100,000 as my initial funds. Firstly, I made a schedule for the game and I have clear objectives for each week. For the first week, I just need to get start with futures and make several attempts.

DEFINITIONS

The most important step is to know the transaction rules of futures. It is a kind of financial contract obligating the buyer to purchase an asset or the seller to sell an asset. After knowing the basic rule, I figured out the definitions of Market Order, Limit Order, Stop Order and Stop Limit Order. The four trading instructions are divided into GTD (Good-till-Date) and GTC (Good-till-Cancelled).

ATTEMPTS

Our purchase objects are limited to grain and oil seeds including corn, soybeans and wheat. I analyzed the recent trends of these three kinds of futures and attempted to open position.

Corn:

The price of corn peaked in Sep. last year and decrease consistently. It shows a fluctuation trend at the low price. I think there will be a rally within a narrow range in these days. So I only buy 2 units and then observe for a period to make further decisions.

Soybean:

The price of soybeans is undergoing a descending process. So I just buy 1 unit. Unfortunately, the price fell the next day after opening position. Maybe I will close position next week.

Wheat:

The price seems to hit the bottom recently. I forecast that the price will rise in a few weeks. So I buy 2 units and maybe short covering next week.

The transactions seem a little haste in the first week. But as with anything, the most important and hard step is to just get started. I think I achieved my first-week goal of understanding the futures and making some attempts.

Everything will be better~ Just go ahead without hesitation.

Lina