
Concerns for Fishery Resources
At present, the United States gives its fishing industry the 200 nautical miles exclusive economic zone off the coast with special fishing rights. This area covers 11.4 million square kilometers which is the largest zone in the world, even exceeding the land area of the United States. The large fishing area makes the United States the fifth leading producer of fish after China, Peru, India and Indonesia, with 3.8 percent of the world total.
Historically, the fisheries developed as each area was settled. Tracing back to 1871, Congress wrote that “… the most valuable food fishes of the coast and the lakes of the U.S. are rapidly diminishing in number, to the public injury, and so as materially to affect the interests of trade and commerce….”
Based on the long history and the large scale of fishing industry in the United States, the sustainability of fishery resources has been a long-standing concern. However, the federal government did not begin actively managing fisheries until the Magnuson–Stevens Fishery Conservation and Management Act (MSA) established in 1976. The Magnuson–Stevens Act is the primary law governing marine fisheries management in United States federal waters.
Obviously, the U.S. Catch Share Programs are authorized under the Magnuson–Stevens Act.
The Catch Share Programs
As defined, catch share programs are “…a fishery management tool that dedicates a secure share of quota allowing individual fishermen, fishing cooperatives, fishing communities or other entities to harvest a fixed amount of fish.” Actually, it is a general term including many specific programs such as “Individual Transferable Quota (ITQs)” programs, “Individual Fishing Quota (IFQ)” programs, “Limited Access Privilege Program” programs, and other exclusive allocation measures such as “Territorial Use Rights Fisheries (TURFs)”.
Catch share programs have been used in U.S. federal fisheries since 1990 and now include 15 different programs currently in operation (see Table 1) from Alaska to Florida managed by six different Councils. Because of the different regions and different councils, I infer that the program design might varies widely and reflects unique fishery characteristics and program objectives. However, after looking through all the 15 programs I find that most of the catch share programs have several objectives in common. The most frequent program objectives can be concluded to be meeting conservation requirements, improving economic efficiency and flexibility, reducing excess capacity, and improving safety at sea.
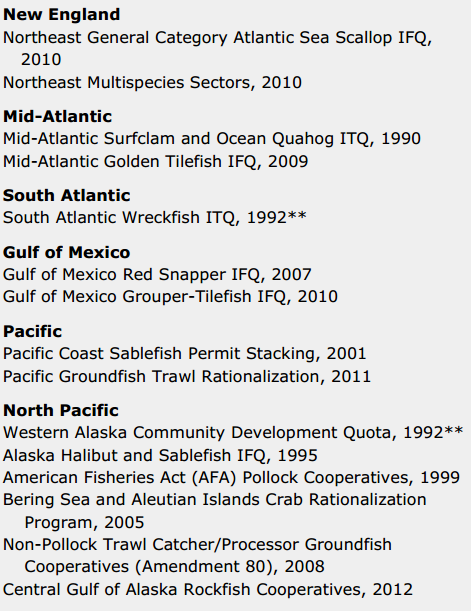
Table 1. U.S. Catch Share Programs by Fishery Management Council
The catch share programs have a more than 20-years history which cover the main regions of American fishing industry including Mid-Atlantic, New England and North pacific, etc. From the list we can find that most of the specific programs basically focus on one category. In my opinion, this kind of set may help achieve the annual catch limits more effectively to eliminate overfishing and reduce the negative biological and economic impacts of the race for fish.
To understand the catch share programs better, I would like to choose one specific program as an example and analyze it in the rest of the blog to present the mechanism and the effects of the programs.
The following graph shows the timeline and the distribution of the programs (see Graph 1). I decide to choose Northeast General Category Atlantic Sea Scallop IFQ from 2010 in New England region.
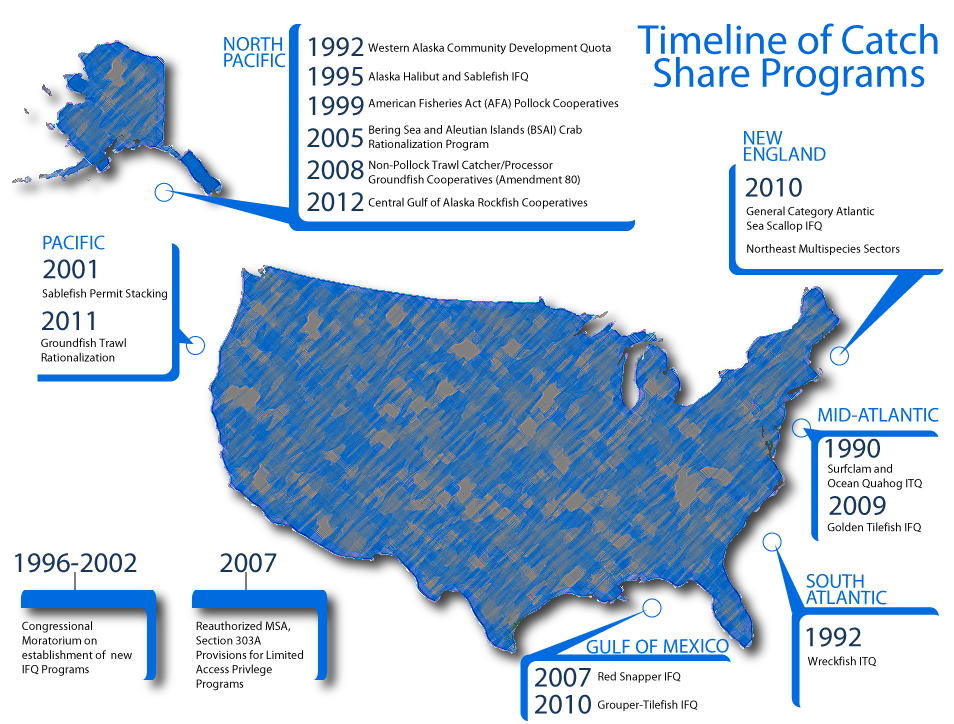
Graph 1. Timeline and Distribution of Catch Share Programs
Work Mechanism of GCASS IFQ
GCASS IFQ refers to General Category Atlantic Sea Scallop Individual Fishing Quota. The Atlantic sea scallop (see Graph 2) is one of the most valuable fisheries in the United States. The primary range for the Atlantic sea scallop fishery is landed in New England and Mid-Atlantic ports. The General Category Scallop fishery was historically an open access fishery, allowing smaller vessels to harvest up to 400 pounds of Atlantic sea scallops. While the scallop fishery was not overfished or experiencing overfishing, there were concerns of overcapacity. In 2007, the New England Fishery Management Council proposed that the limited access fleet received 95% and the General Category Scallop Individual Fishing Quota (IFQ) fleet received 5% of total quota.
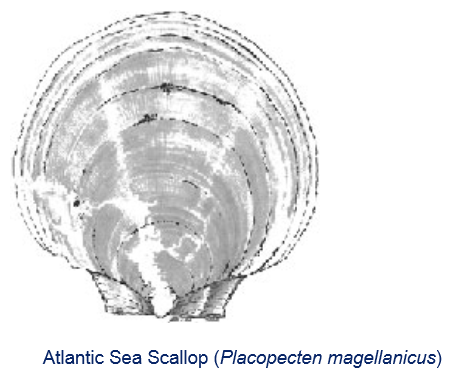
Graph 2. Atlantic Sea Scallop
As we all know, the purpose of quota share caps is to prevent individual shareholders from controlling production, as well as to achieve management objectives. The IFQ Program is subject to an ownership cap set at no more than 2.5% for any one vessel and 5% for any one individual. In the event that a single entity (an individual owner or ownership group) owns more than one vessel, the entity may not hold more than 5% of the total allocation. Allocations may be transferred on a permanent basis or transferred on an annual basis to another IFQ allocation holder, provided the ownership caps are maintained.
The effects of GCASS IFQ
There are two clear objectives of the Scallop IFQ Program. The first one is to control capacity and mortality in the general category scallop fishery. The second one is to allow for better timely integration of sea scallop assessment results in management.
In the first year of IFQ Program, implementation of the general category quota was set at 2.6 million (5% of the total scallop quota) pounds of scallop meats. The general category scallop fleet landed 4.1 million pounds of scallop meats during the Baseline Period[1]. Almost 2.3 million pounds, or 89% of the quota was utilized in 2010 (see Graph 3).
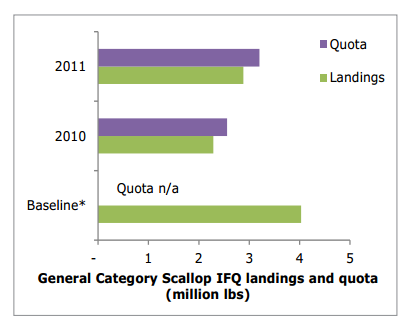 Graph 3
Capacity, as measured by active vessels decreased by almost one-half in 2010 when compared to the Baseline Period. In 2011, the number of entities holding quota share decreased by 12% and the number of active vessels decreased by 4% in 2011.
Economic benefits, as measured by scallop revenue, and average prices have increased under the IFQ Program. Despite scallop landings decreasing 43% in 2010 relative to the Baseline Period, revenue only decreased by 24%. This was in part due to higher prices. However, in 2011, landings of scallops increased by 26% and revenue increased by 50% relative to the previous year. Ex-vessel prices for scallops increased from $6.52 in the Baseline Period to $8.78 per pound in 2010 and to $10.40 in 2011, a 60% increase in average price since the Program began.
Economic efficiency, as measured by revenue per vessel, has been steadily increasing since implementation of the IFQ Program. Revenue per vessel increased by 31% to $127,000 in 2010 when compared to the Baseline Period* and increased by 55% in 2011 relative to 2010.
Total revenue from scallop trips and non-scallop trips was $50 million during the Baseline Period. Total revenue increased by 23% to $62 million in 2010 and by another 33% to $83 million in 2011.
Revenue Distribution, as measured by the Gini coefficient which measures the distribution of revenue among entities holding shares in the Scallop IFQ Program. The Gini coefficient for the General Category Scallop IFQ Program increased from 0.51 in the Baseline Period* to 0.55 in 2010 and decreased to 0.53 in 2011.
Conclusion
Overall, these programs were successful in having fishermen observe quota limits, improving overall economic benefits and efficiency, and ending the race to fish, thereby reducing pressure on fishermen to fish during unsafe conditions. Catch share programs have also been effective in reducing fishing capacity. However, catch share programs have had distributional consequences as reductions in the number of active vessels may have been counterbalanced by reductions in the number of shareholders.
References
[1] Ayeisha A. Brinson and Eric M. The Economic Performance of U.S. Catch Share Programs. U.S. Department of Commerce, August 2013
[2] NOAA Catch Share Performance Indicator Series, 2013
[3] United Nations Convention on the Law of the Sea – Part V
[4] NOAA CATCH SHARE POLICY. National Oceanic and Atmospheric Administration. 2010.
[1] Baseline Period refers to average of three years prior to General Category Scallop IFQ implementation (2007 – 2009).