Lab 2: Understanding Geographic Data
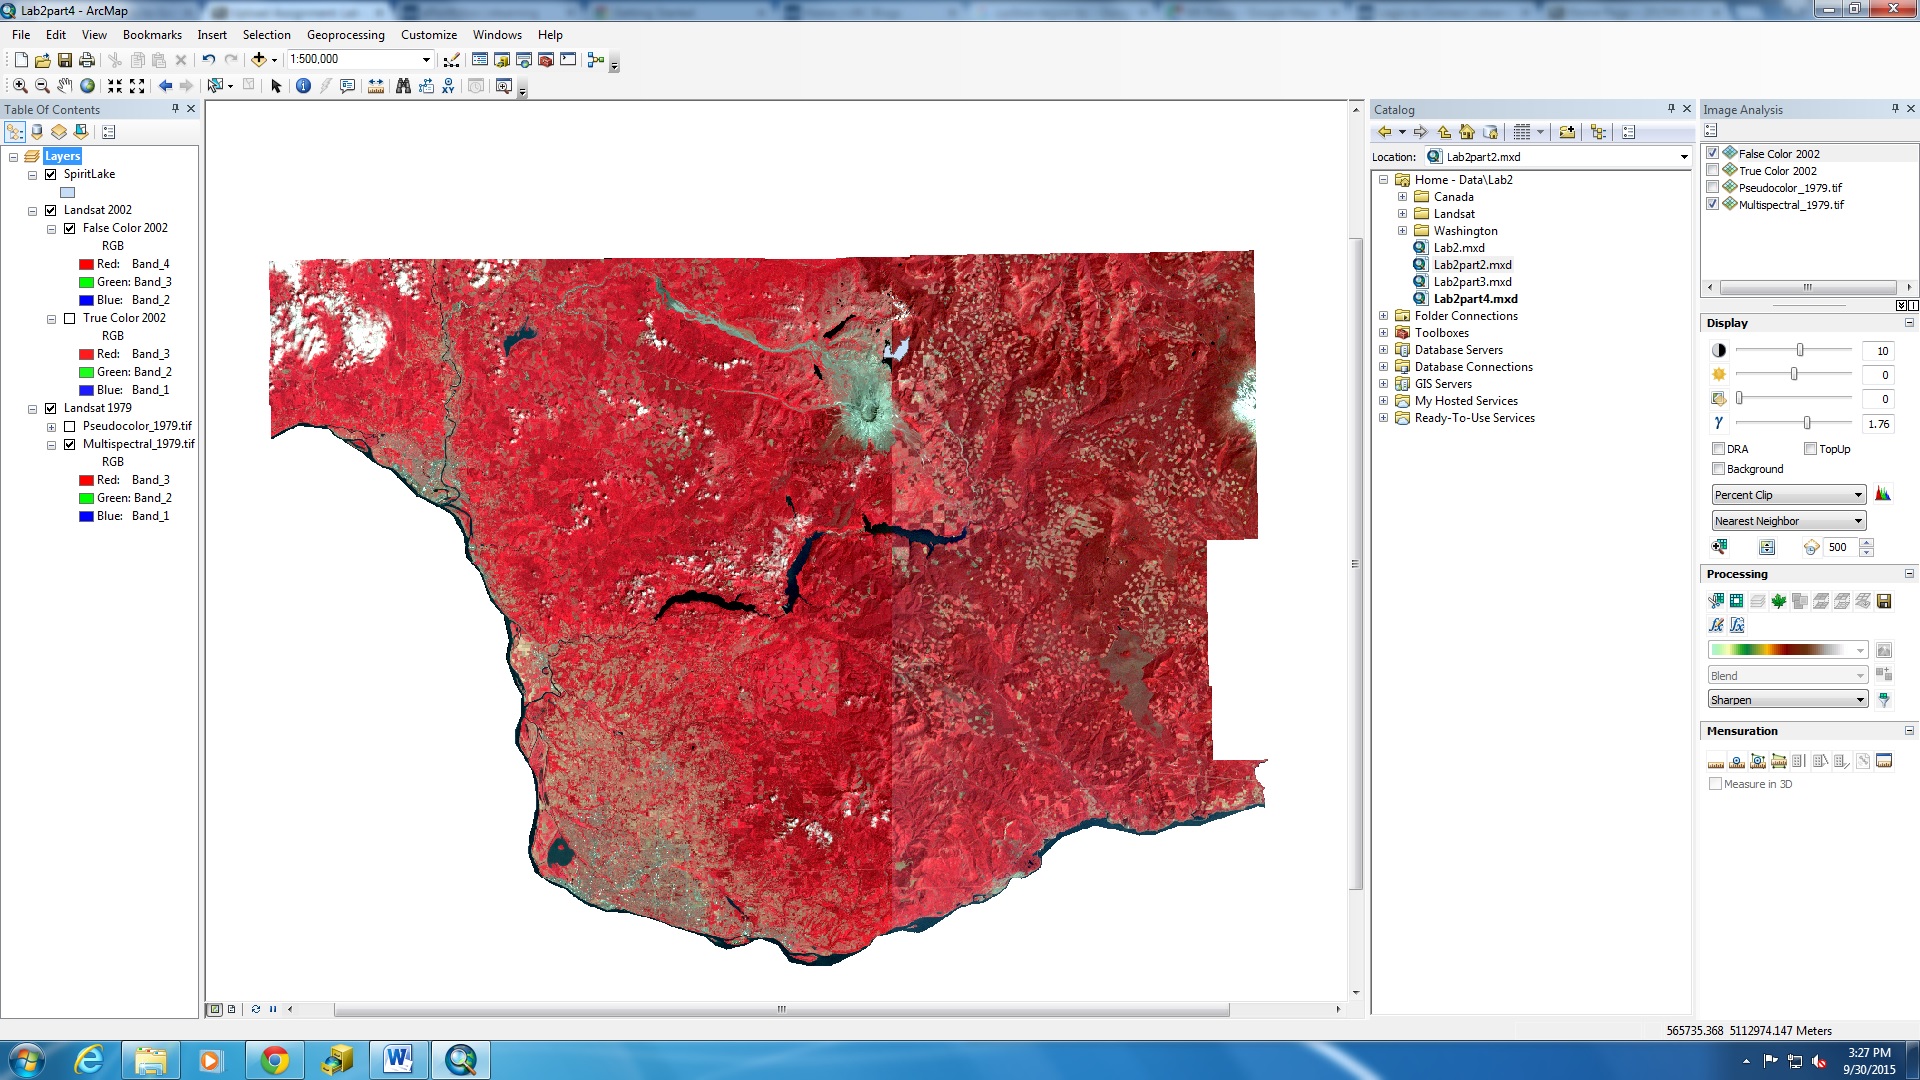
In this exercise we explored spatial map data of Canada and Washington State in the U.S. while learning about coordinate systems, datums, projections, and spatial data models (raster and vector data). We also used raster landsat data to review the before and after of Mt. St. Helen’s volcanic eruption in 1980.
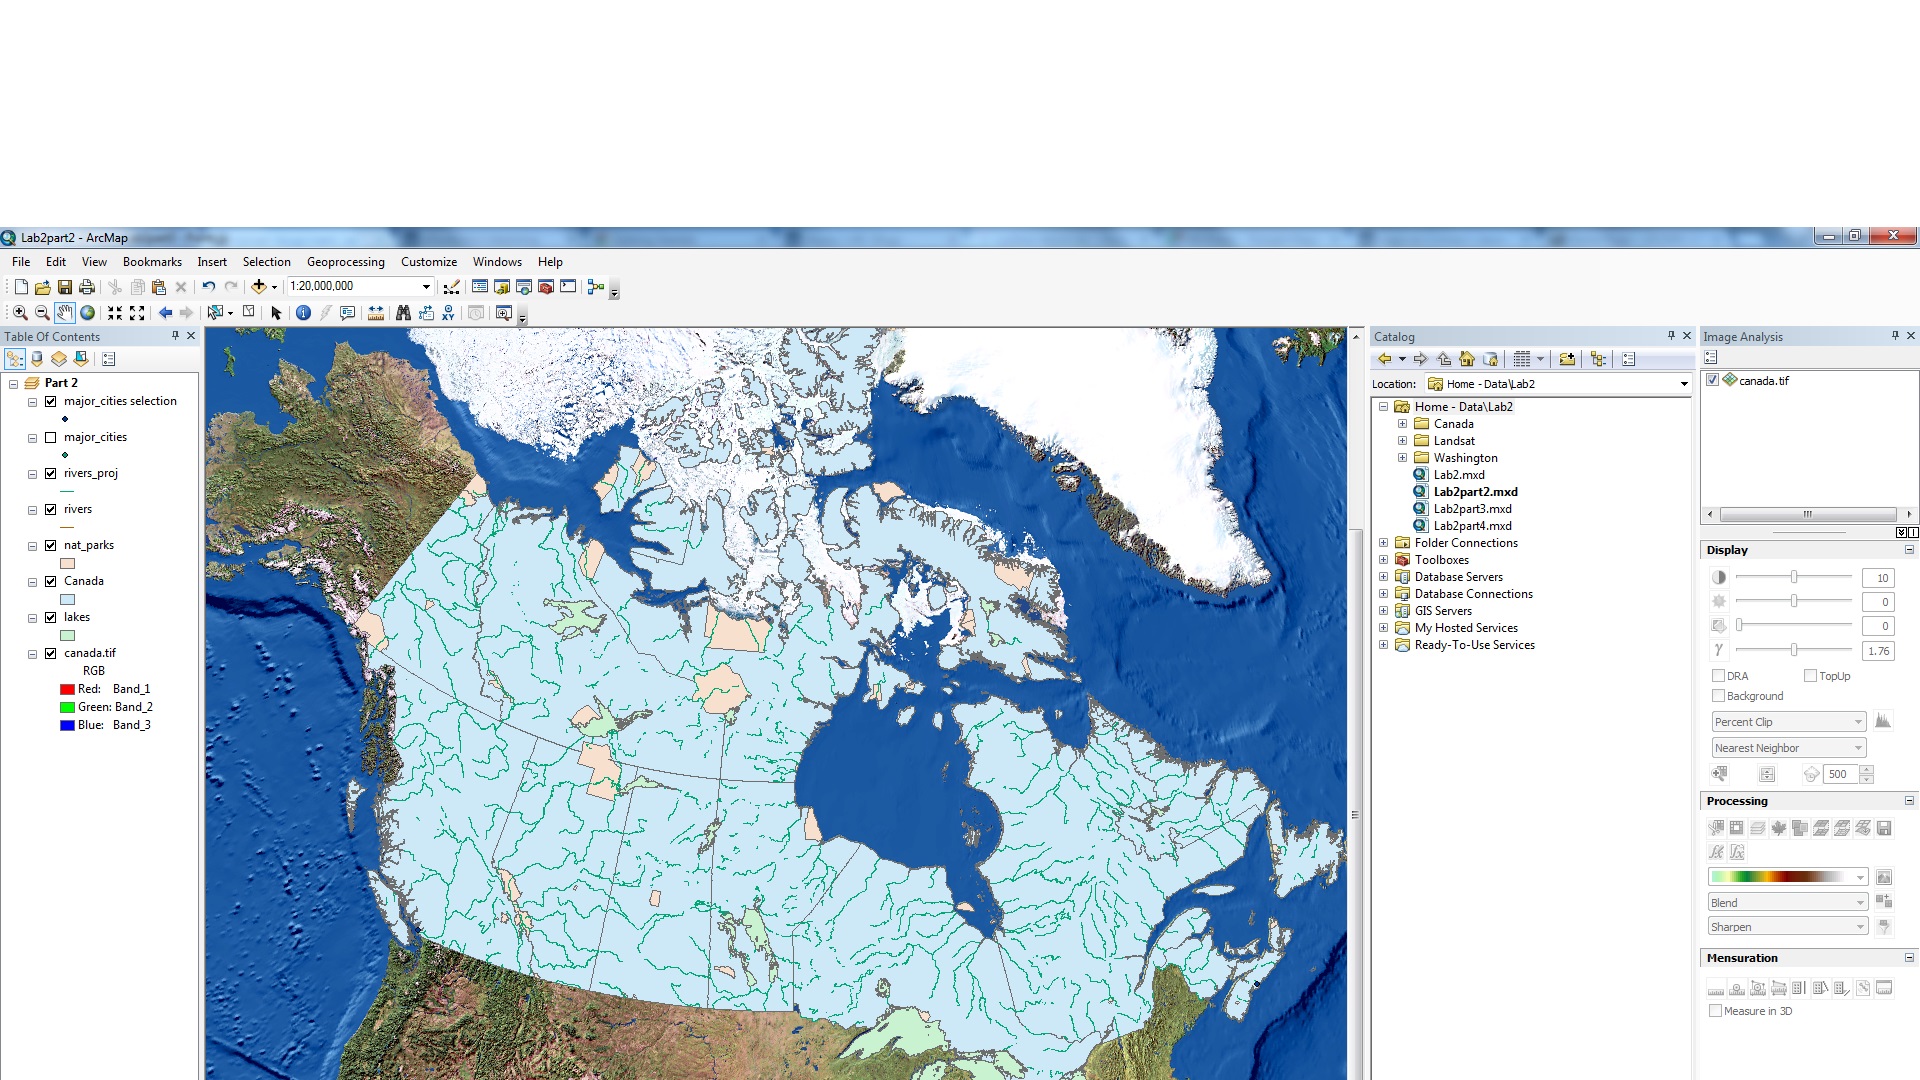
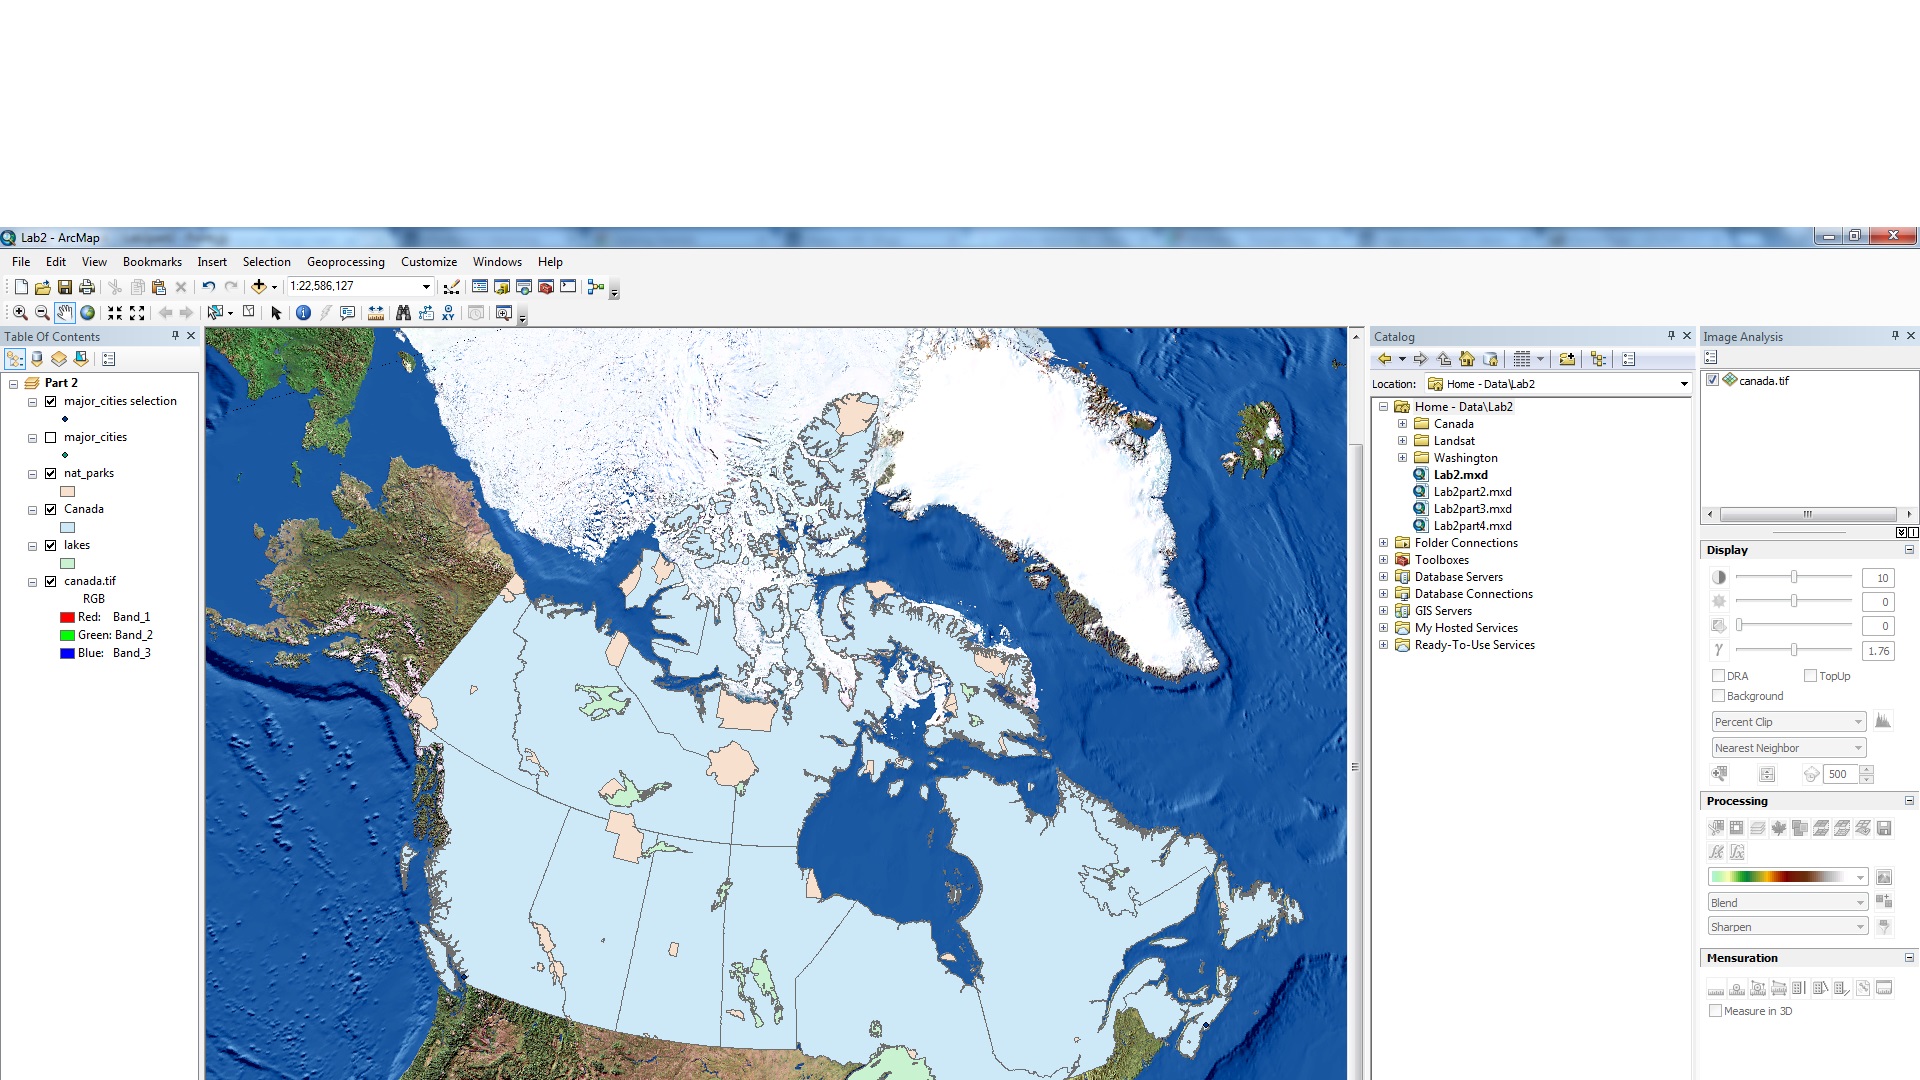
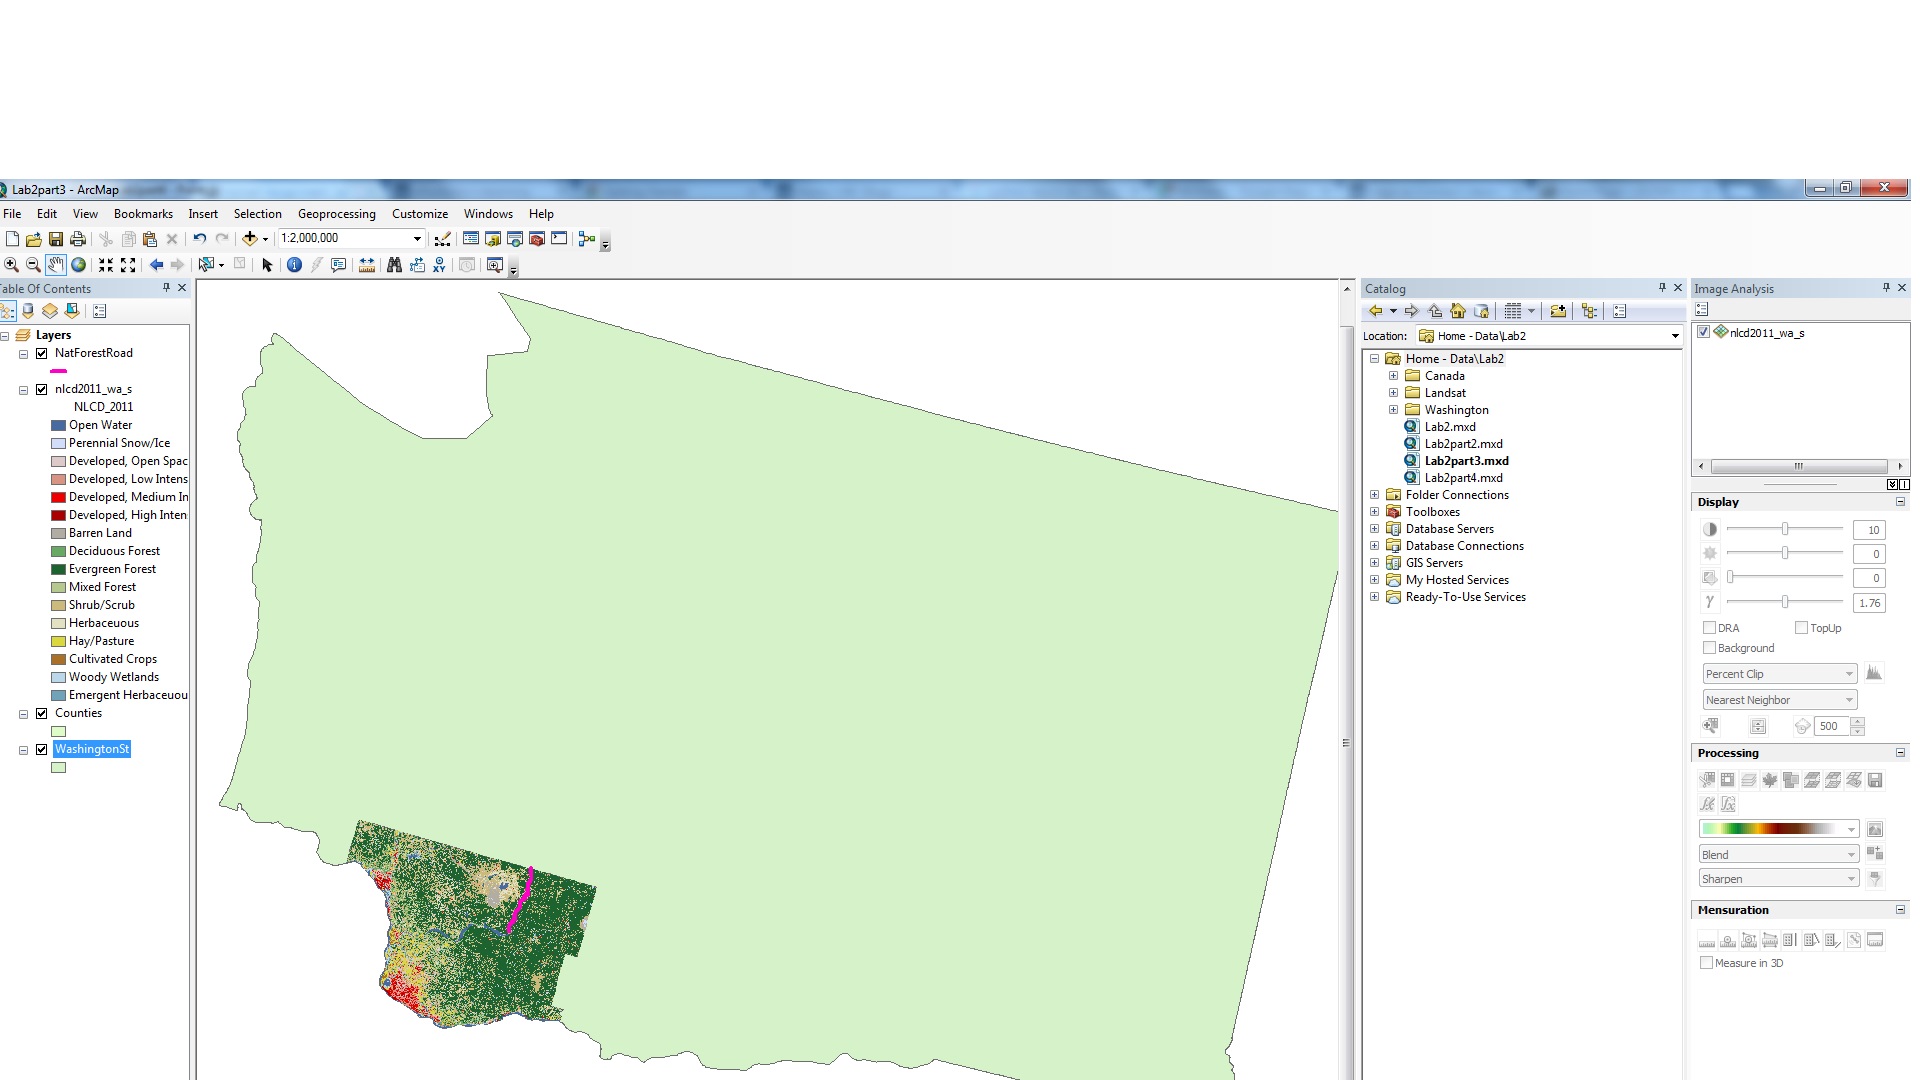
Above: Images of maps created in Lab 2
In the last part of the lab we focused on Landsat Data to understand how remote sensing works. An example where Landsat Data would be useful for something like Landslides (ie the Hope landslide or the Mount Polley tailings dam breach). The kinds of questions that might be relevant would be how much volume of material has been displaced before and after the landslide and the time interval needed for landsat data would probably be on a yearly timescale. It would be best to gather landsat data for this situation in the spring or summer months where the landmass is not covered in snow and the details of the damage done by the landslide is most distinct. The geographical location of both of these areas are based in the Cariboo and Thompson region of British Columbia where the quality of Landsat images may be dependent on the season.
Accomplishment Statement: After this lab, I learned that the data used in making a map needs to be referenced properly and need to have consistent coordinate systems and projections. In addition, I determined the difference between raster and vector data and which situations where one may be better than the other. Raster data may be used for continuous data and vector data for more discreet data sets.