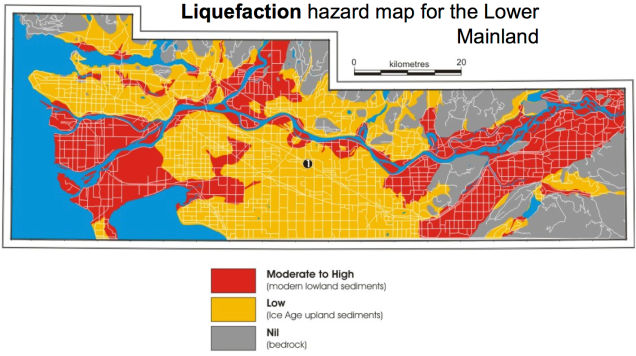
This image above illustrates the level of risk associated with liquefaction or the potential for water saturated soil competency to diminish significantly in the event of an earthquake in the lower mainland. The message is clear as it does use a colour scheme that is easily associated with levels of intensity; red associating high risk and danger, yellow meaning a lower risk and grey meaning little or no effect in response to an earthquake. This map is clear and free of clutter which allows for the audience to clearly distinguish which areas of Vancouver will be most affected.
The geospatial data used may be information about the soil types such as quaternary glacial sediments, bedrock and modern, incompetent sediments (ie gravel, landfill, peat, etc) susceptible to shaking induced by earthquakes. Other information for this map may include major roads in the lower mainland that may be affected.
Accomplishment Statement: In addition to the examples that illustrate how GIS is important to our everyday lives, I have also completed the introductory course that teaches students how to use ArcMap and ArcCatalog. From this I learned basic and practical skills that are essential for interpreting map data for a specific purpose.