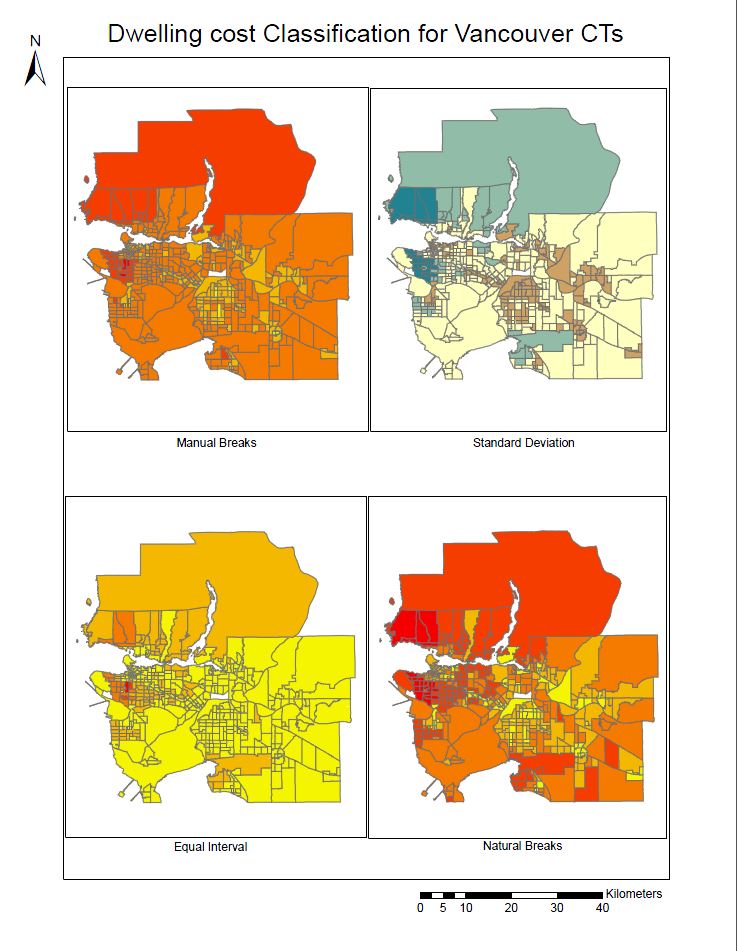
Quantitative Data Classification: Different classifications of data can be used to represent data on a map, in this case being the affordability of housing in both Vancouver and Montreal. Using different types of classifications (Natural breaks, manual breaks, equal interval and standard deviation) can influence how the data is display and how the audience interprets the data in concordance with a colour scheme.
In the eyes of a journalist, I would most likely use the manual breaks classification as I would want to communicate the high cost of living for young people who are looking to move to Vancouver. On the other hand, if I were a real estate agent instead, I would most likely use the equal interval classification as it represents areas around UBC to look more affordable than they actually are. There are ethical implications for the choice of classification as it can make your audience believe that housing is more affordable than in reality.
Housing Affordability:
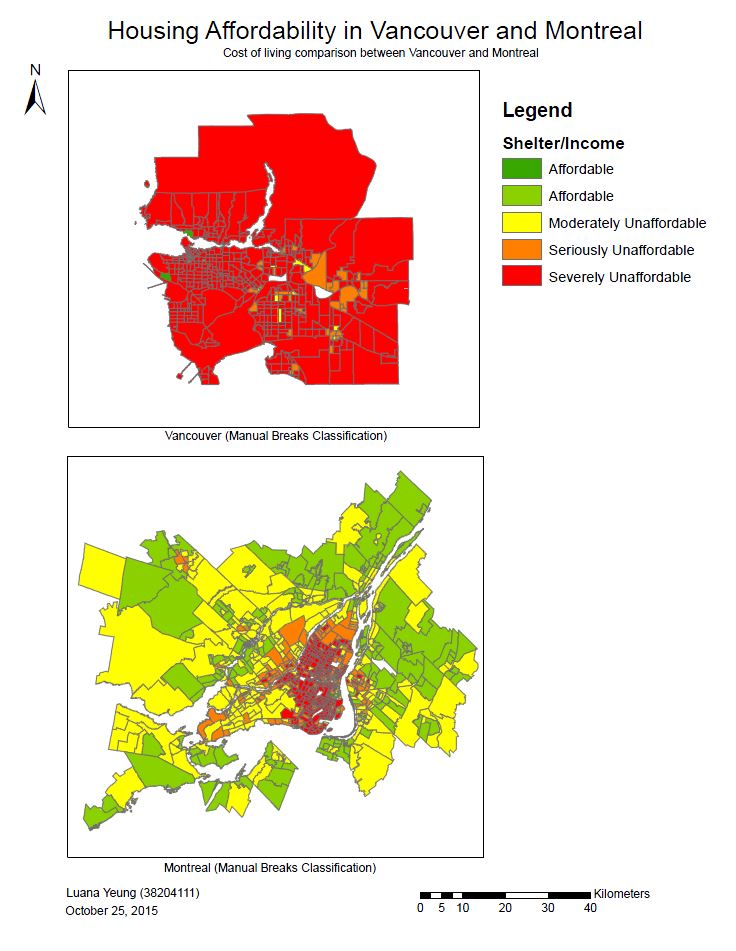
The map above contrasts the housing affordability for the cities of Vancouver and Montreal. By looking at the maps, you can clearly see that the housing affordability market for Vancouver is in the seriously to severely unaffordable range.
Affordability measures the cost of shelter over income. This is a better way to compare housing affordability than housing cost alone as the amount of income is a normalizing factor. By doing this, we can take into consideration the fraction of income that individuals in a household need to spend on housing to live. In this case, even though those who live in larger cities may earn a higher income, this does not mean that the same individuals can afford to live with their current wages based on the standard of living.
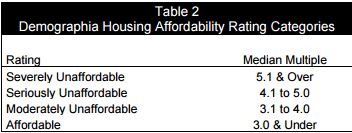
Above are the housing affordability rating categories. The Demographia International Housing Affordability Survey uses the “Median Multiple” (median house price/gross annual median household income) to asses affordability. In my opinion, I think it can be trusted as this method is the standard used worldwide for evaluating urban markets and has been recommended by the World Bank and the UN.
Though affordability might be an attractive quality when looking for a place to live, it may not be the most livable. In a city such as Vancouver, it is a more desirable place to live due to the fact that the weather is much more mild all year round and has all the amenities that are attractive to a wide variety of people (ie. outdoor activities, green space, young and vibrant culture). Since Vancouver has such a wide variety of things to offer people from all backgrounds, it attracts more people to the city which results in higher cost of living due to the lack of housing supply to the high demand. In many ways, perhaps the more livable areas have the least affordability due to the fact that everyone wants to live in a particular area.
Accomplishment Statement: In this lab I have learned practical skills in Arc such as joining tables of data into shapefile data and using data classifications to manipulate datasets to interpret and represent the data in a way that is engaging for a particular audience.