Graphs and visualizations often help us understand relationships between sets of data. It is powerful because of its capability to demonstrate connections between information that may be overwhelming. It often makes things easier to understand. The Palladio tool offers an intriguing way of visualizing data that allows customization where it provides more insight and variety into the dataset, but it is also important to note that interpreting a dataset without purpose can lack valuable information. While the visualizations showed the connections between the music choices of my peers and also grouped them based on the strength of these choices, creating communities of individuals with similar responses, it did not capture the reasons behind the choices.
These visualizations can show us the “Degree of Connectivity” between data nodes where the degree of a node in a network is a measure of the number of connections it has to other nodes. It must be noted that connectivity is often a positive thing but might not always be so such as a virus (Network Connections, 2015).
In assignment #8, we were asked to curate and narrow down 27 songs from the Golden Record to 10 songs based on our own criteria. This is significant because everyone in the class may have selected their songs based on their own set of criteria that are meaningful to them. For example, I chose various songs based on what I thought would represent us if the record were to ever reach other living species. I wanted to be inclusive of different cultures and I also picked songs that evoked certain feelings and emotions such as “joyful” and “uplifting”. However, my peers may have selected songs based on their personal preferences. Everyone’s thinking process is different and individuals have different personal upbringings and experiences that may have influenced their decision when given the task to curate and select their top 10 songs. This task could have been interpreted in various ways, thus leading to a wide range of data, highlighting the significance of clear guidelines and intentions when working with datasets.
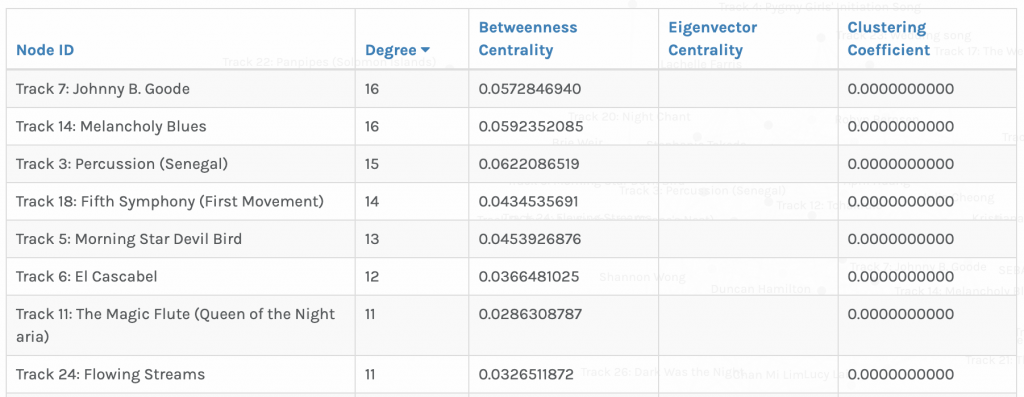
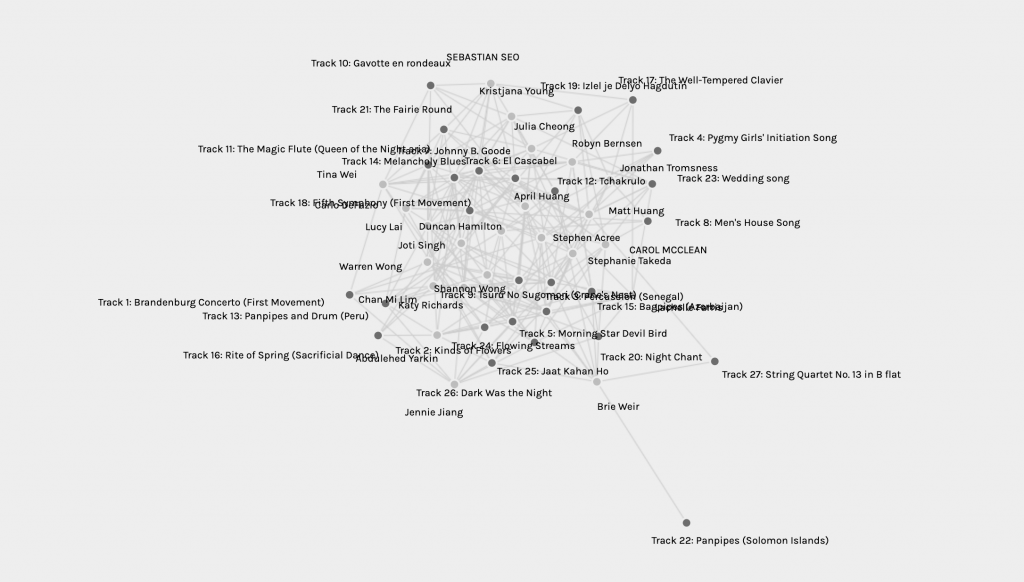
I was interested in finding out which songs were the top choices in the class. When looking at the curated tracks, I noticed that Johnny B. Good and Melancholy Blues were popular choices with a high degree of connectivity. They both had 16 picks. I thought perhaps it is because these songs are familiar to us and are big influences in the music scene in North America. To me, this would be a big factor in our connectivity because our geographical location and proximity would play a part and influence our musical selections. But do I truly know the reasons behind the choices of my peers? No. I can only guess or assume to the best of my knowledge why these songs were favored by my peers. Only they would be able to answer why they made that particular choice. This is important because it demonstrates that although a strong connection is illustrated, the reasoning and story behind these connections are missing.
As I continued to look closely at these visualizations, I wanted to understand who I had similar choices with. In my group, there were four of us – Sebastian, Julia, April, and I.

Upon examining the image above, I can see a clear connection regarding our song choices. However, again, I do not know the reasons behind each group member’s decisions. At first, it may seem like a good idea to have the help of Palladio in creating visualizations, but we must remember that the tools we use require datasets that are given by human beings. Often, individuals will have biases and assumptions, so we must look at these visualizations with a critical eye and particular guidance. Just like the information provided to us daily on the internet, we must be mindful of reputable and credible sources. With this task, we may be able to see a lot of connections regarding the curated song choices, but to fully understand the reasoning behind these connections will require a closer understanding of each person individually.
References
Code.org. (2017, June 13). The Internet: How Search Works . Retrieved from https://youtu.be/LVV_93mBfSU.
[Nat and Friends]. (2016, December 16). A journey to the bottom of the internet [Video]. YouTube. https://www.youtube.com/watch?v=H9R4tznCNB0.
[Systems Innovation]. (2015, April 18). Graph theory overview [Video]. YouTube. https://www.youtube.com/watch?v=82zlRaRUsaY&t=3s.
[Systems Innovation]. (2015, April 19). Network Connections [Video]. YouTube. https://www.youtube.com/watch?v=2iViaEAytxw&t=12s.