Visually, the network appears to be fairly evenly distributed. There are no overtly obvious tight clusters or empty spaces. However, without knowing the algorithm which determines how to physical draw the nodes of the network, it is hard to know if this is a direct by-product of the data or some smoothing occurring at the algorithmic level.
Not quite willing to entirely trust my initial interpretation of the visual presentation (at least somewhat because I have some challenges with visual processing), I decided to do a deeper dive on the data. Some of my observations are:
- 21 Contributors
- 2 songs chosen by more than ½ the community
- 7 songs in the middle: 9 – 10 choices
- 11 songs at 7 -8 choices
- 7 songs chosen by less than 1/3 of the community
- Every song chosen at least 4 times.
This fairly even distribution would suggest a wide variety amongst the group, covering the full breadth of the available song list. The histogram of this data does, however, suggest there is a noticeable outlier:
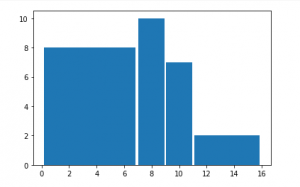
While a bar chart of the data reveals the specific song:
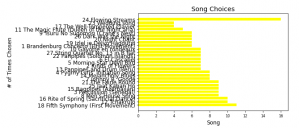
However, with the information that we have, it is impossible to know the exact reason that this song was so frequently chosen. Given that this is the single on the list from China, my best guess is that there may be a sense of representing the populations on earth – which would make a song from China a common choice. The only way to know for sure will be to inspect every individual’s page for their own personal selection algorithm.
I also looked at the connections between individuals. By matching each song in each person’s list with all of the other lists I was able to determine that there is a great deal of consistency in terms of overall connection numbers. Most people have between 70 and 80 overall connections, with only 2 outliers over 80 and two under 70. This suggests to me that my initial impression of a fairly evenly distributed network was correct and that it was accurately depicted on the network diagram as a valid product of the data on which it was based. It is possible that this is just a natural artefact of the process – but since I am not a statistician I cannot know for sure.
What I think this means overall is that we are an incredibly diverse group that made choices based on disparate criteria. The result was a series of lists that covered all of the tracks in a fairly even distribution.