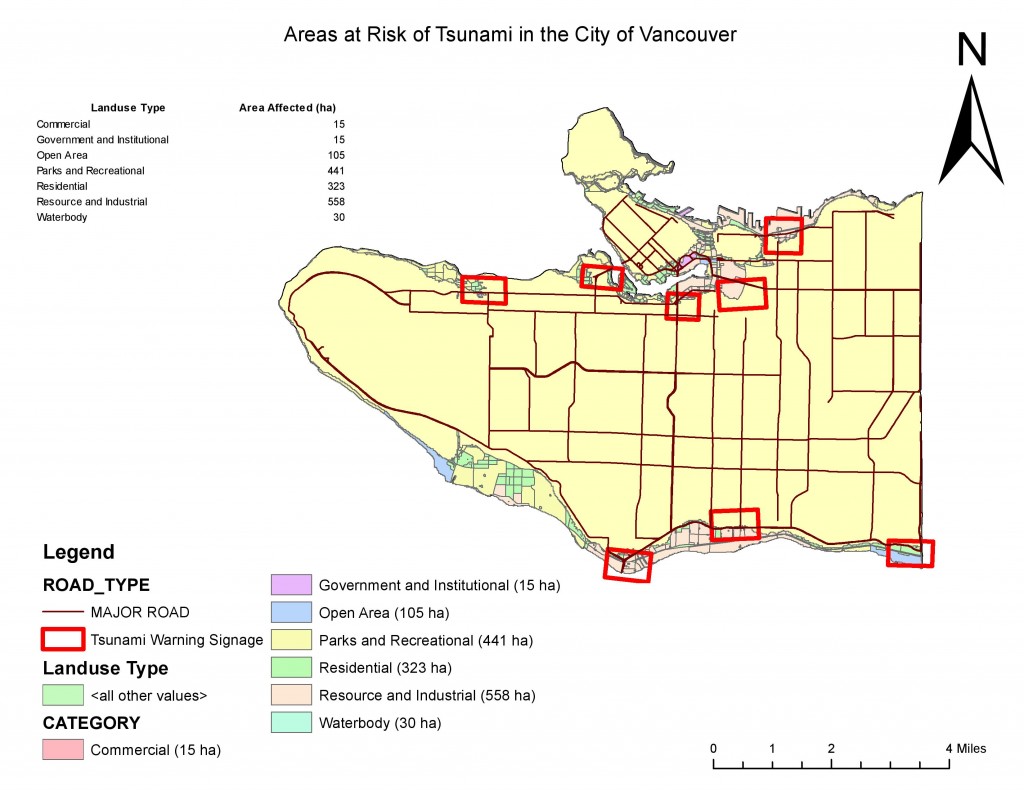
The City Vancouver has always been forewarned of a risk of a large scale earthquake due to its position on the Juan de Fuca plate and the North American Plate (City of Vancouver, 2014). The possibility of a major earthquake also raises concern for tsunamis. Although there is less of a concern for a tsunami to hit the coastline of the City of Vancouver due the geographic position of Vancouver Island which guards the city, it is good knowledge to be aware which areas of the city is most in risk of a tsunami. In this Lab, the areas at risk of a tsunami are addressed and mapped applying skills of spatial analysis, tables, and editing.
- Percentage of the City of Vancouver’s Total Area in Danger:
- Utilizing the Statistics Tool available in ArcGIS, I calculated the percentage of the city of Vancouver’s total area under danger to be 11.3%.
- The specific command syntax used to compute this value is as follows: [(Area of Vancouver_landuse_danger_intersect)/(Area of Vancouver_landuse)]*100.
- Determining the healthcare and educational institutions within the Danger Zone:
- To determine the healthcare and educational institutions located within the danger zone, I utilized the Intersect tool found in the ArcToolbox, to first intersect (Vancouver_danger) and (Vancouver_eduation), and then repeat with (Vancouver_danger) and (Vancouver_health).
- As a result, I computed that there are five educational facilities, and four health care facilities within Vancouver’s danger zone.
Through the learning process of becoming resourceful with ArcGIS, I:
- gained and demonstrated my understanding of maps and their implications of integrity and ethics with their projections.
- productively utilized tools available in ArcGIS (eg. Statistics, Intersect) to articulate tabular and spatial data in the form of a visual representation (ie. a map).
- generated a comprehensive map projecting the areas at risk of tsunami in the City of Vancouver.
