QUANTITATIVE DATA CLASSIFICATION:
When working with data, it is critical to be aware of the implications of how we present that data, and how we are manipulating it. Data can be easily influenced to support individual motives, and thus can be concerning of how the data can put of context and mean something entirely different from what it was originally intending to represent.
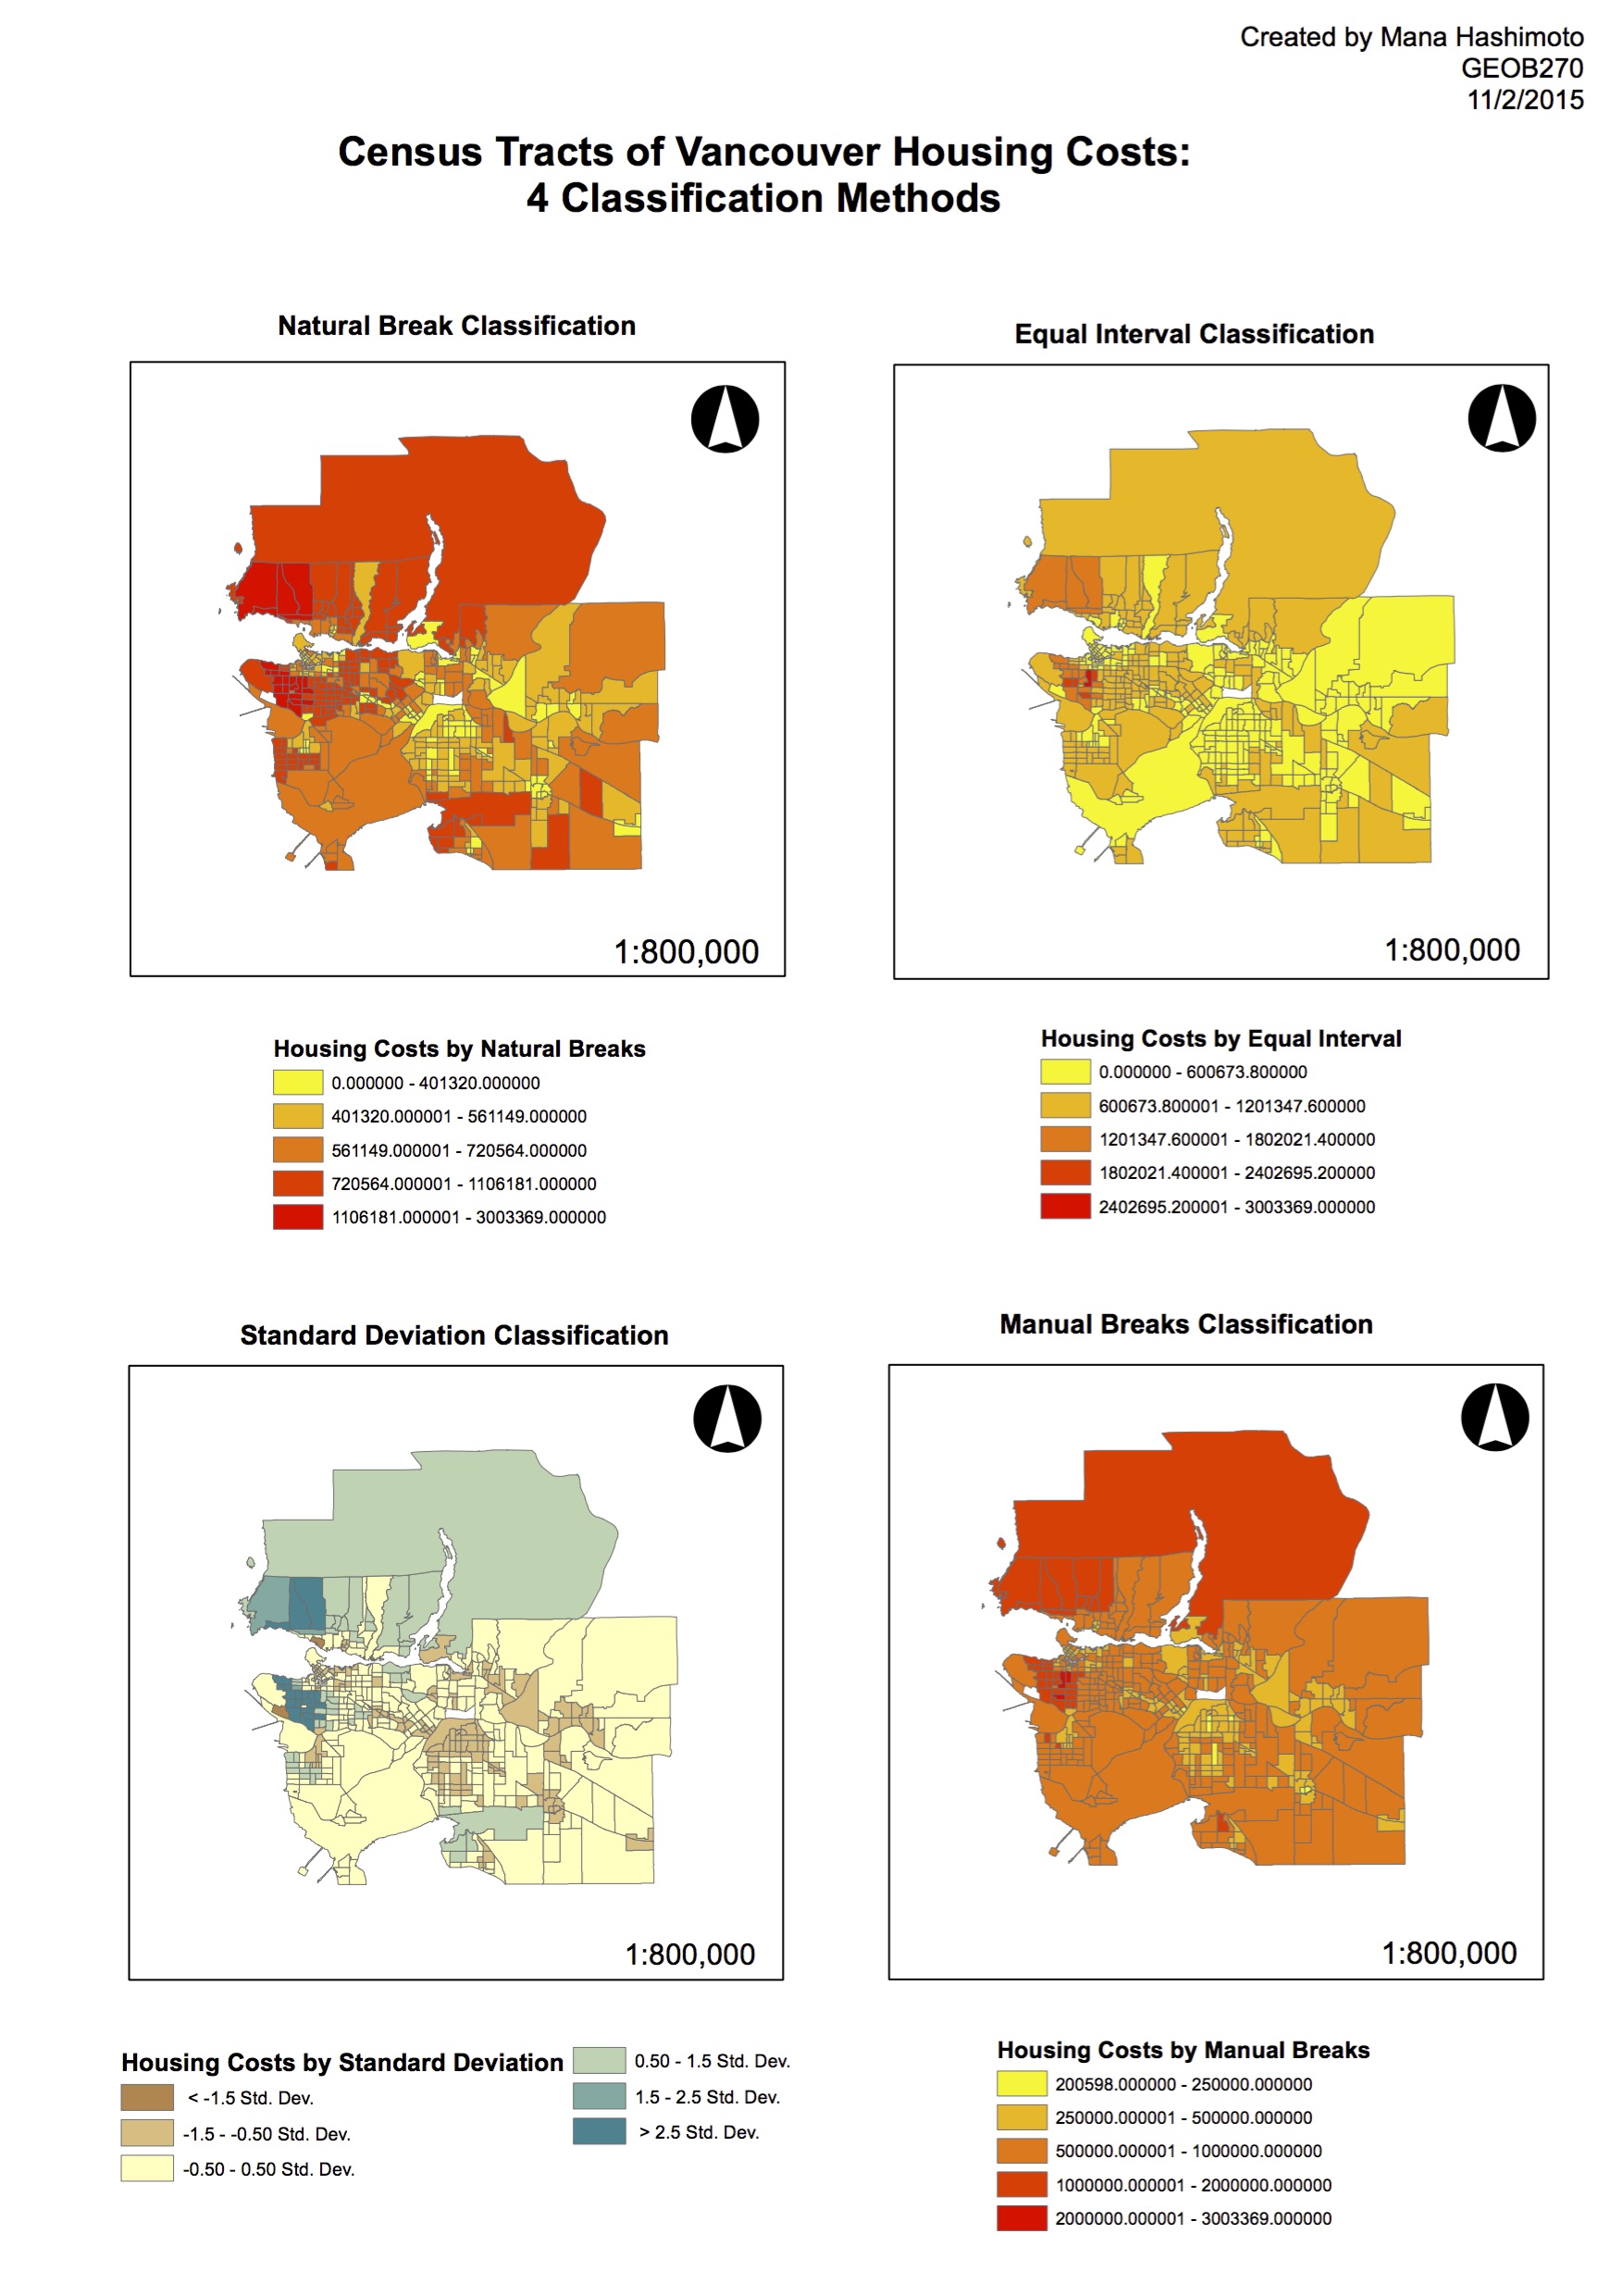
For instance, if I were a journalist, since I would want to write up an article that would catch people’s’ attention, I would probably use the Manual Breaks Classification Method, as it effectively illustrates the narrative of an ‘overall unaffordable Metro Vancouver’.
But as a real estate agent, since I would want to present the region as more affordable, I would represent the area using the Equal Interval Classification because, relative to the other classification methods, the region is not categorized as the most costly region. Furthermore, compared to the Natural and Manual Breaks classified maps, the because it uses the colour red less, the Equal Interval map is easier to read without being overwhelmed.
Thus, there are major ethical implications for the quantitative data classification methods chosen as the data can be easily misrepresented to illustrate personal interests, rather than classification methods that would allow the reader or the buyer to make the best possible decision.
HOUSING AFFORDABILITY:
- Understanding the difference between Housing Cost, and Affordability
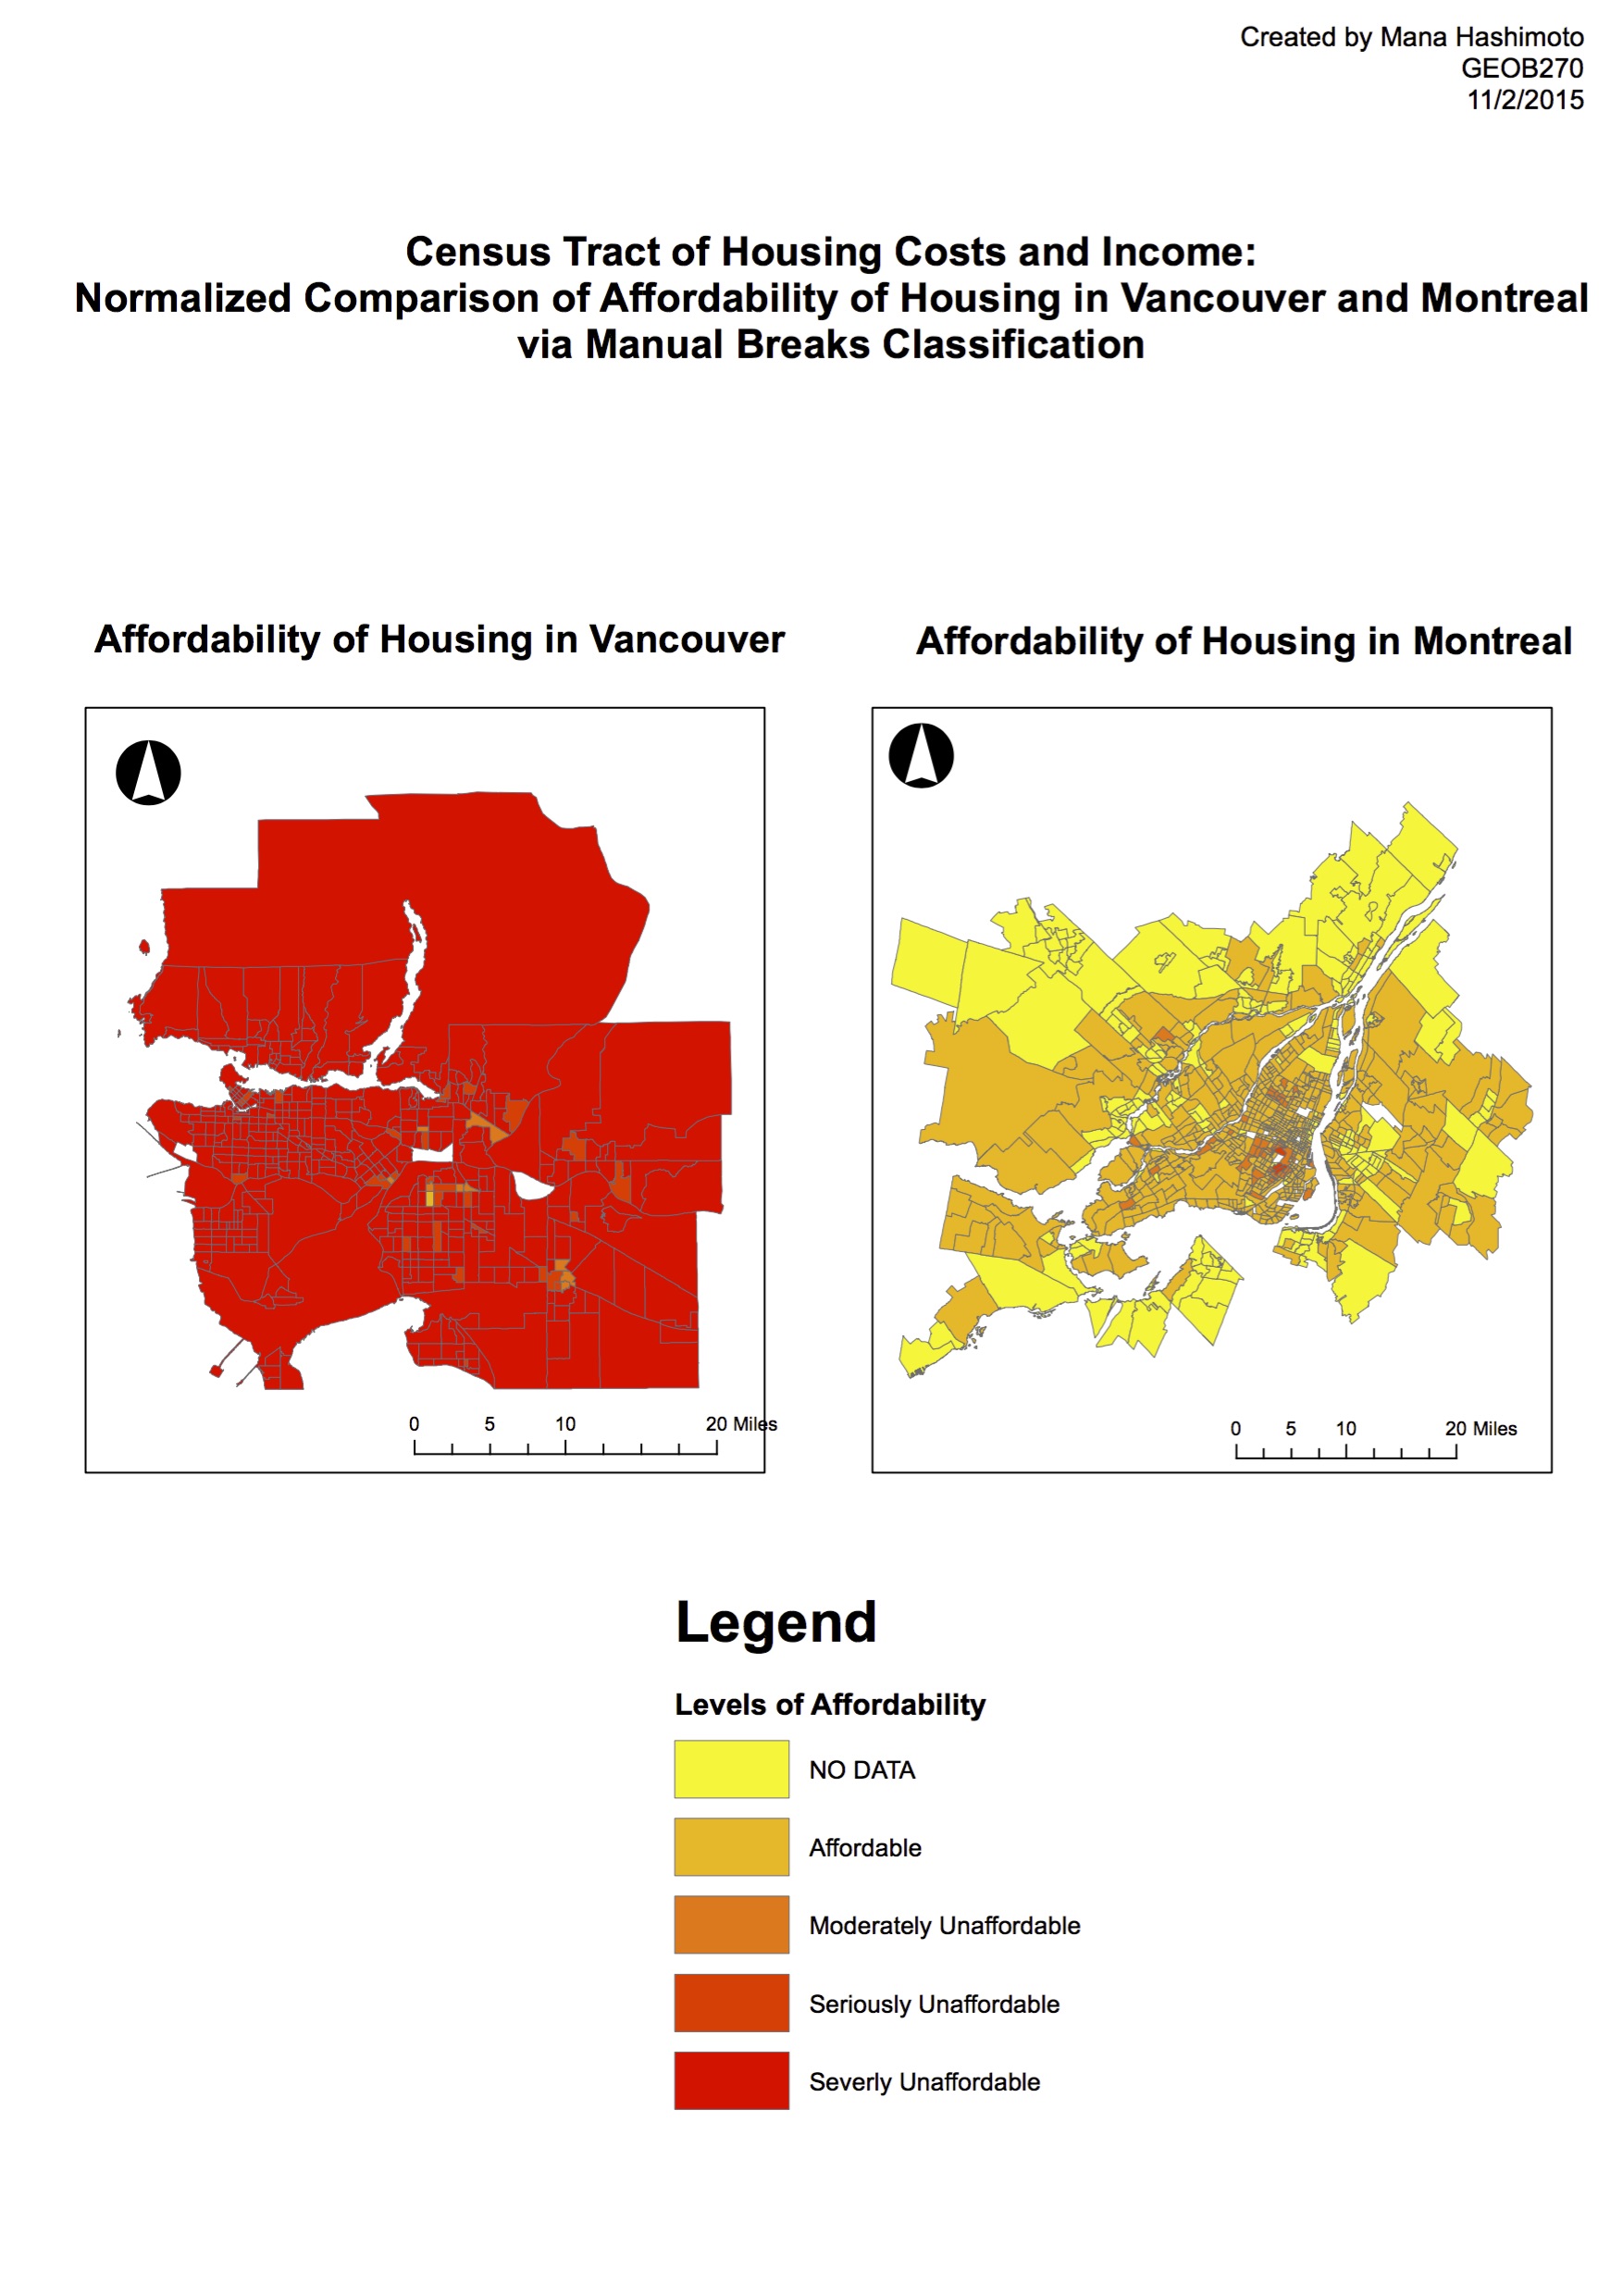
- Affordability, is a measurement relative to the income of the region. Even if housing cost is high, depending on the average income of that region, that home may still be at an affordable price relative to the income.
- Thus, a measurement index that compares average income with the absolute housing cost is a better indicator of affordability than just the cost of housing.
- The Demographia International Housing Affordability Survey (DIHAS)
- The housing affordability rating categories are based on the idea of the “median multiple” as suggested by the The Demographia International Housing Affordability Survey. The survey defines the median multiple as “median house price divided by gross annual median household income”.
-
- The survey states that “domestic public policy should, first and foremost, be focused on improving the standard of living and reducing poverty” rather than “urban design or the physical layout of the cities” (9), indicating their clear purpose behind creating this indicator.
- Is affordability a good indicator of a city’s ‘livability’?
- Although the city of Vancouver has been recognized numerous times as the one of the best places to live in the world, the reality for many living in the city has been of struggle. Many citizens of Vancouver have continued to have a love-hate relationship with the city because they love the city, but they cannot afford to live in it and thus their experience of living in Vancouver is devalued. In these terms, a high ‘livability’ index does not always mean that citizens are all happy, and therefore affordability is a major criteria to measure a city’s actual ‘livability’.