Category Archives: Uncategorized

Accomplishment Statements and Individual Professional Development Reflection

Accomplishment Statements:

In investigating the Affordability of Housing in Vancouver and Montreal (Lab 4), and conducting an Environmental Impact Assessment of the proposed Garibaldi Lake Ski Resort in Squamish(Lab 5), I learned many new techniques using the ArcGIS software.

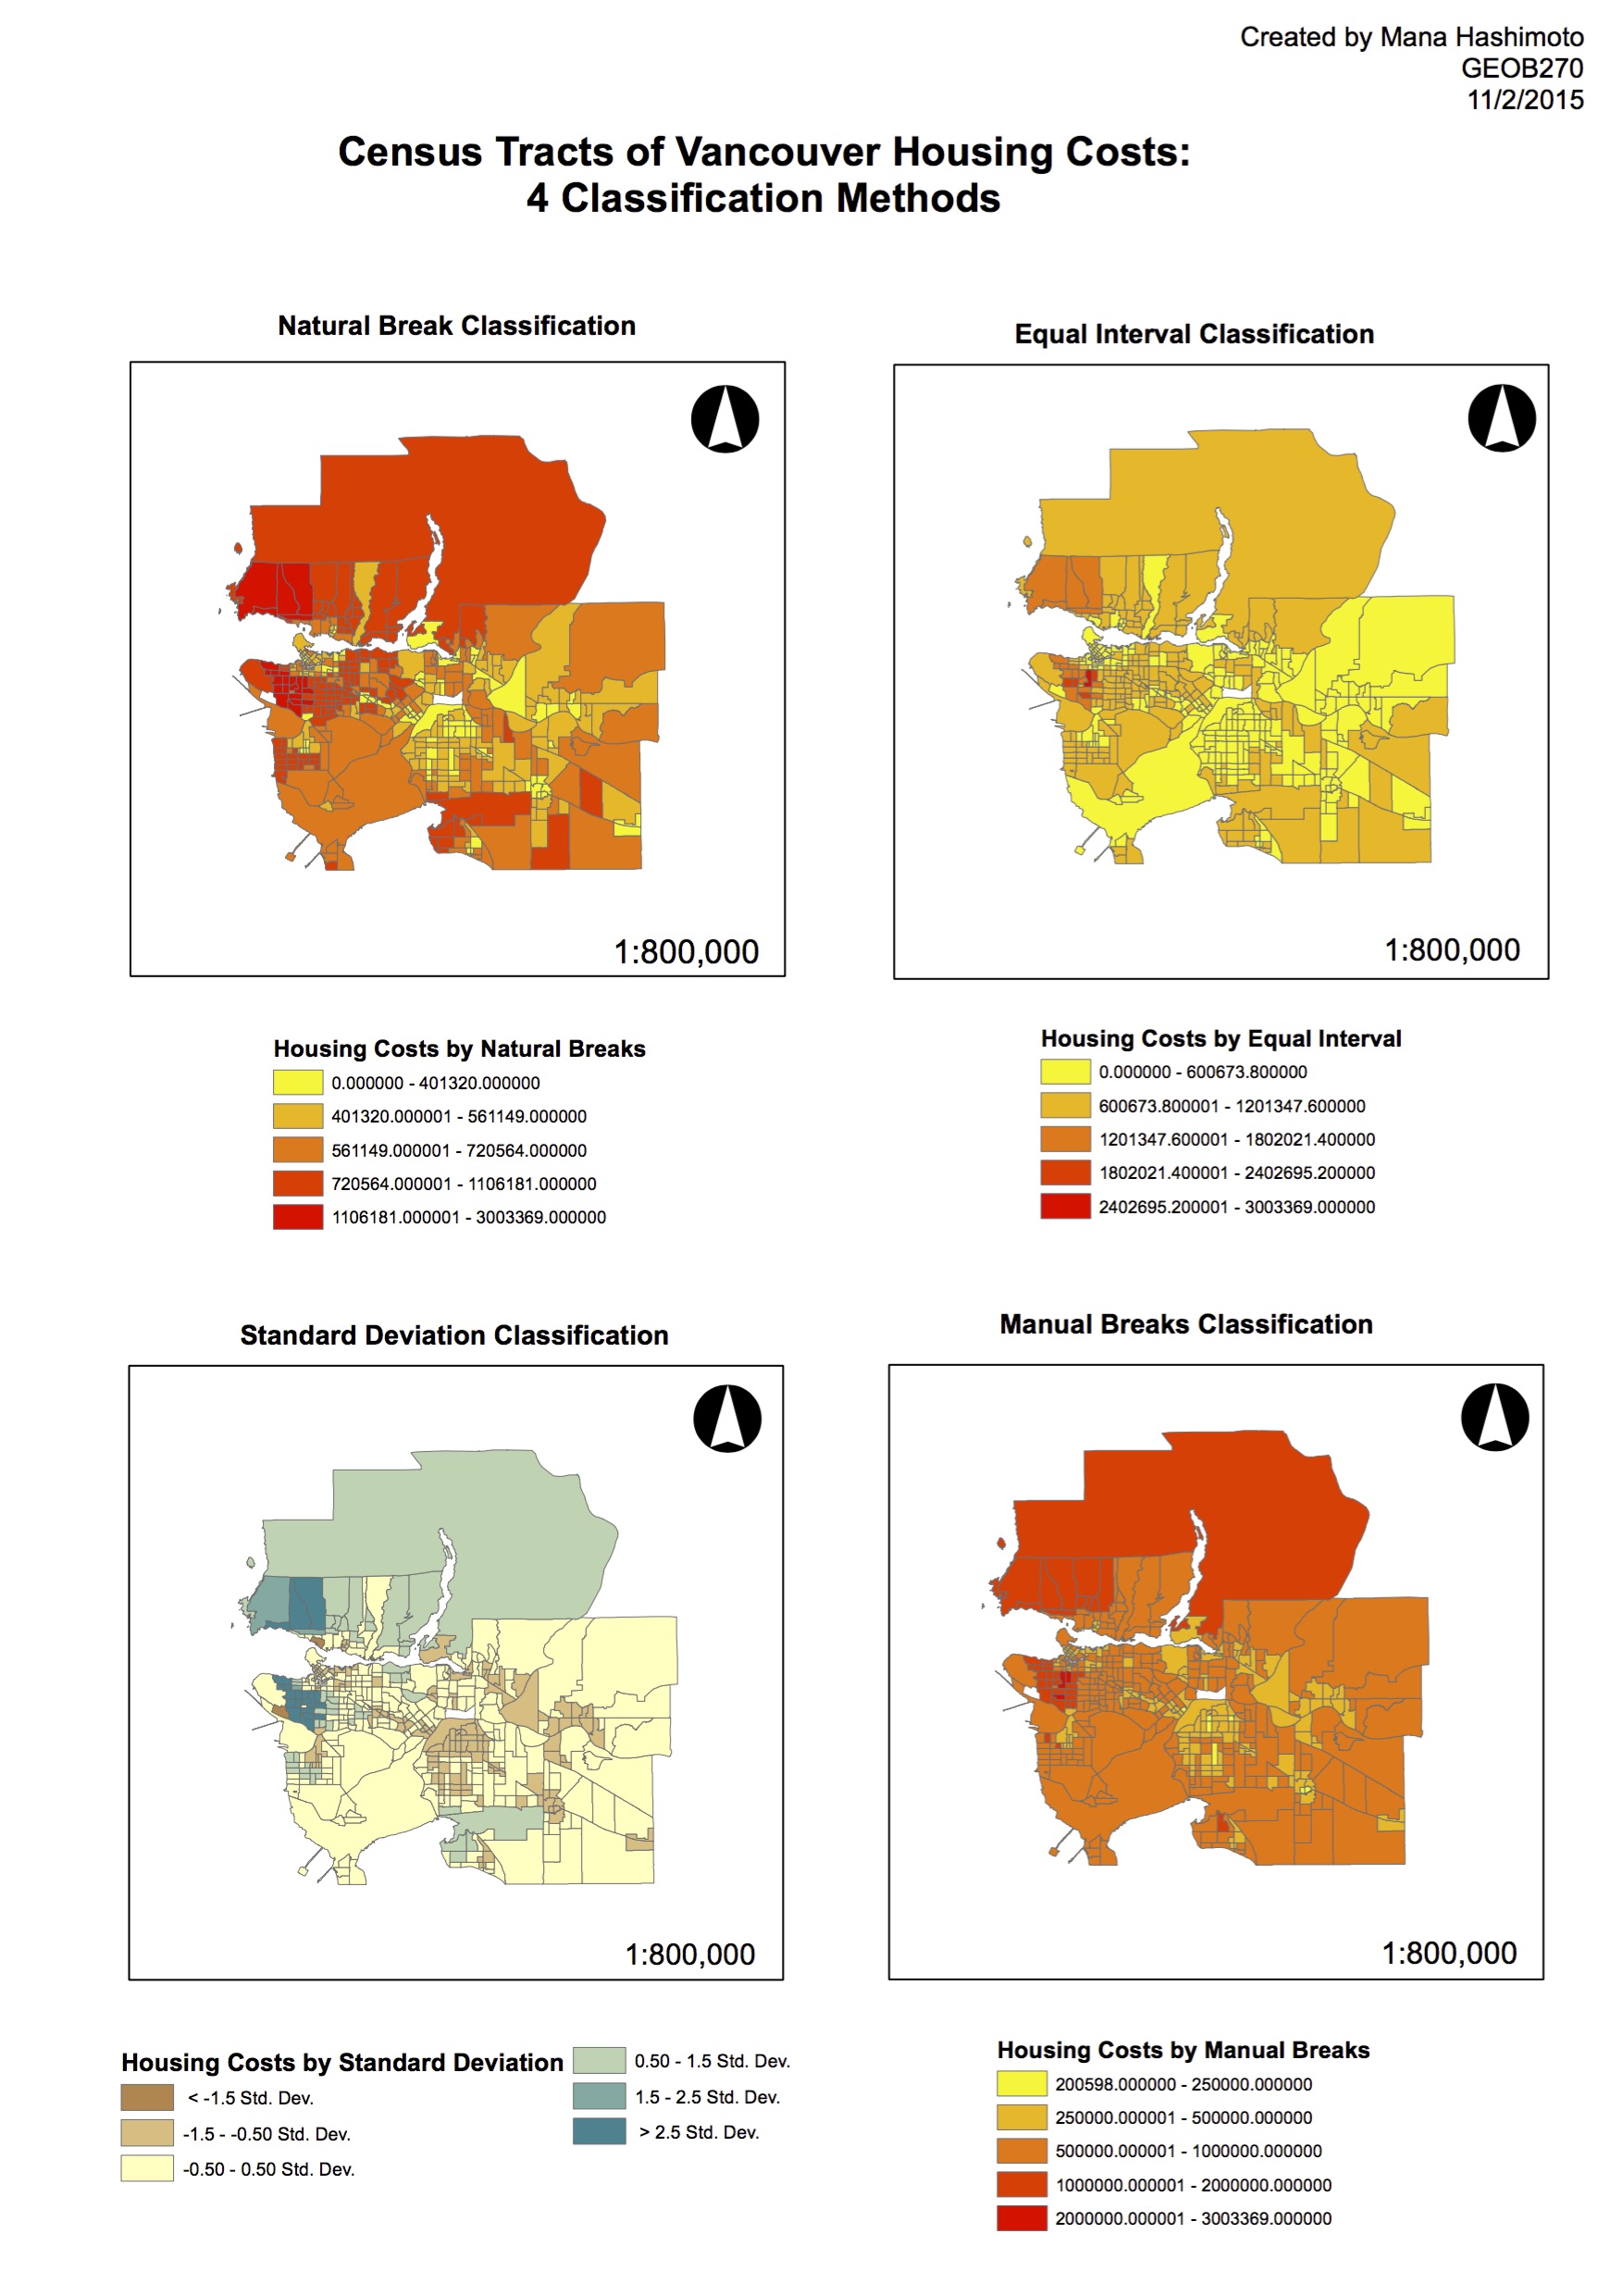
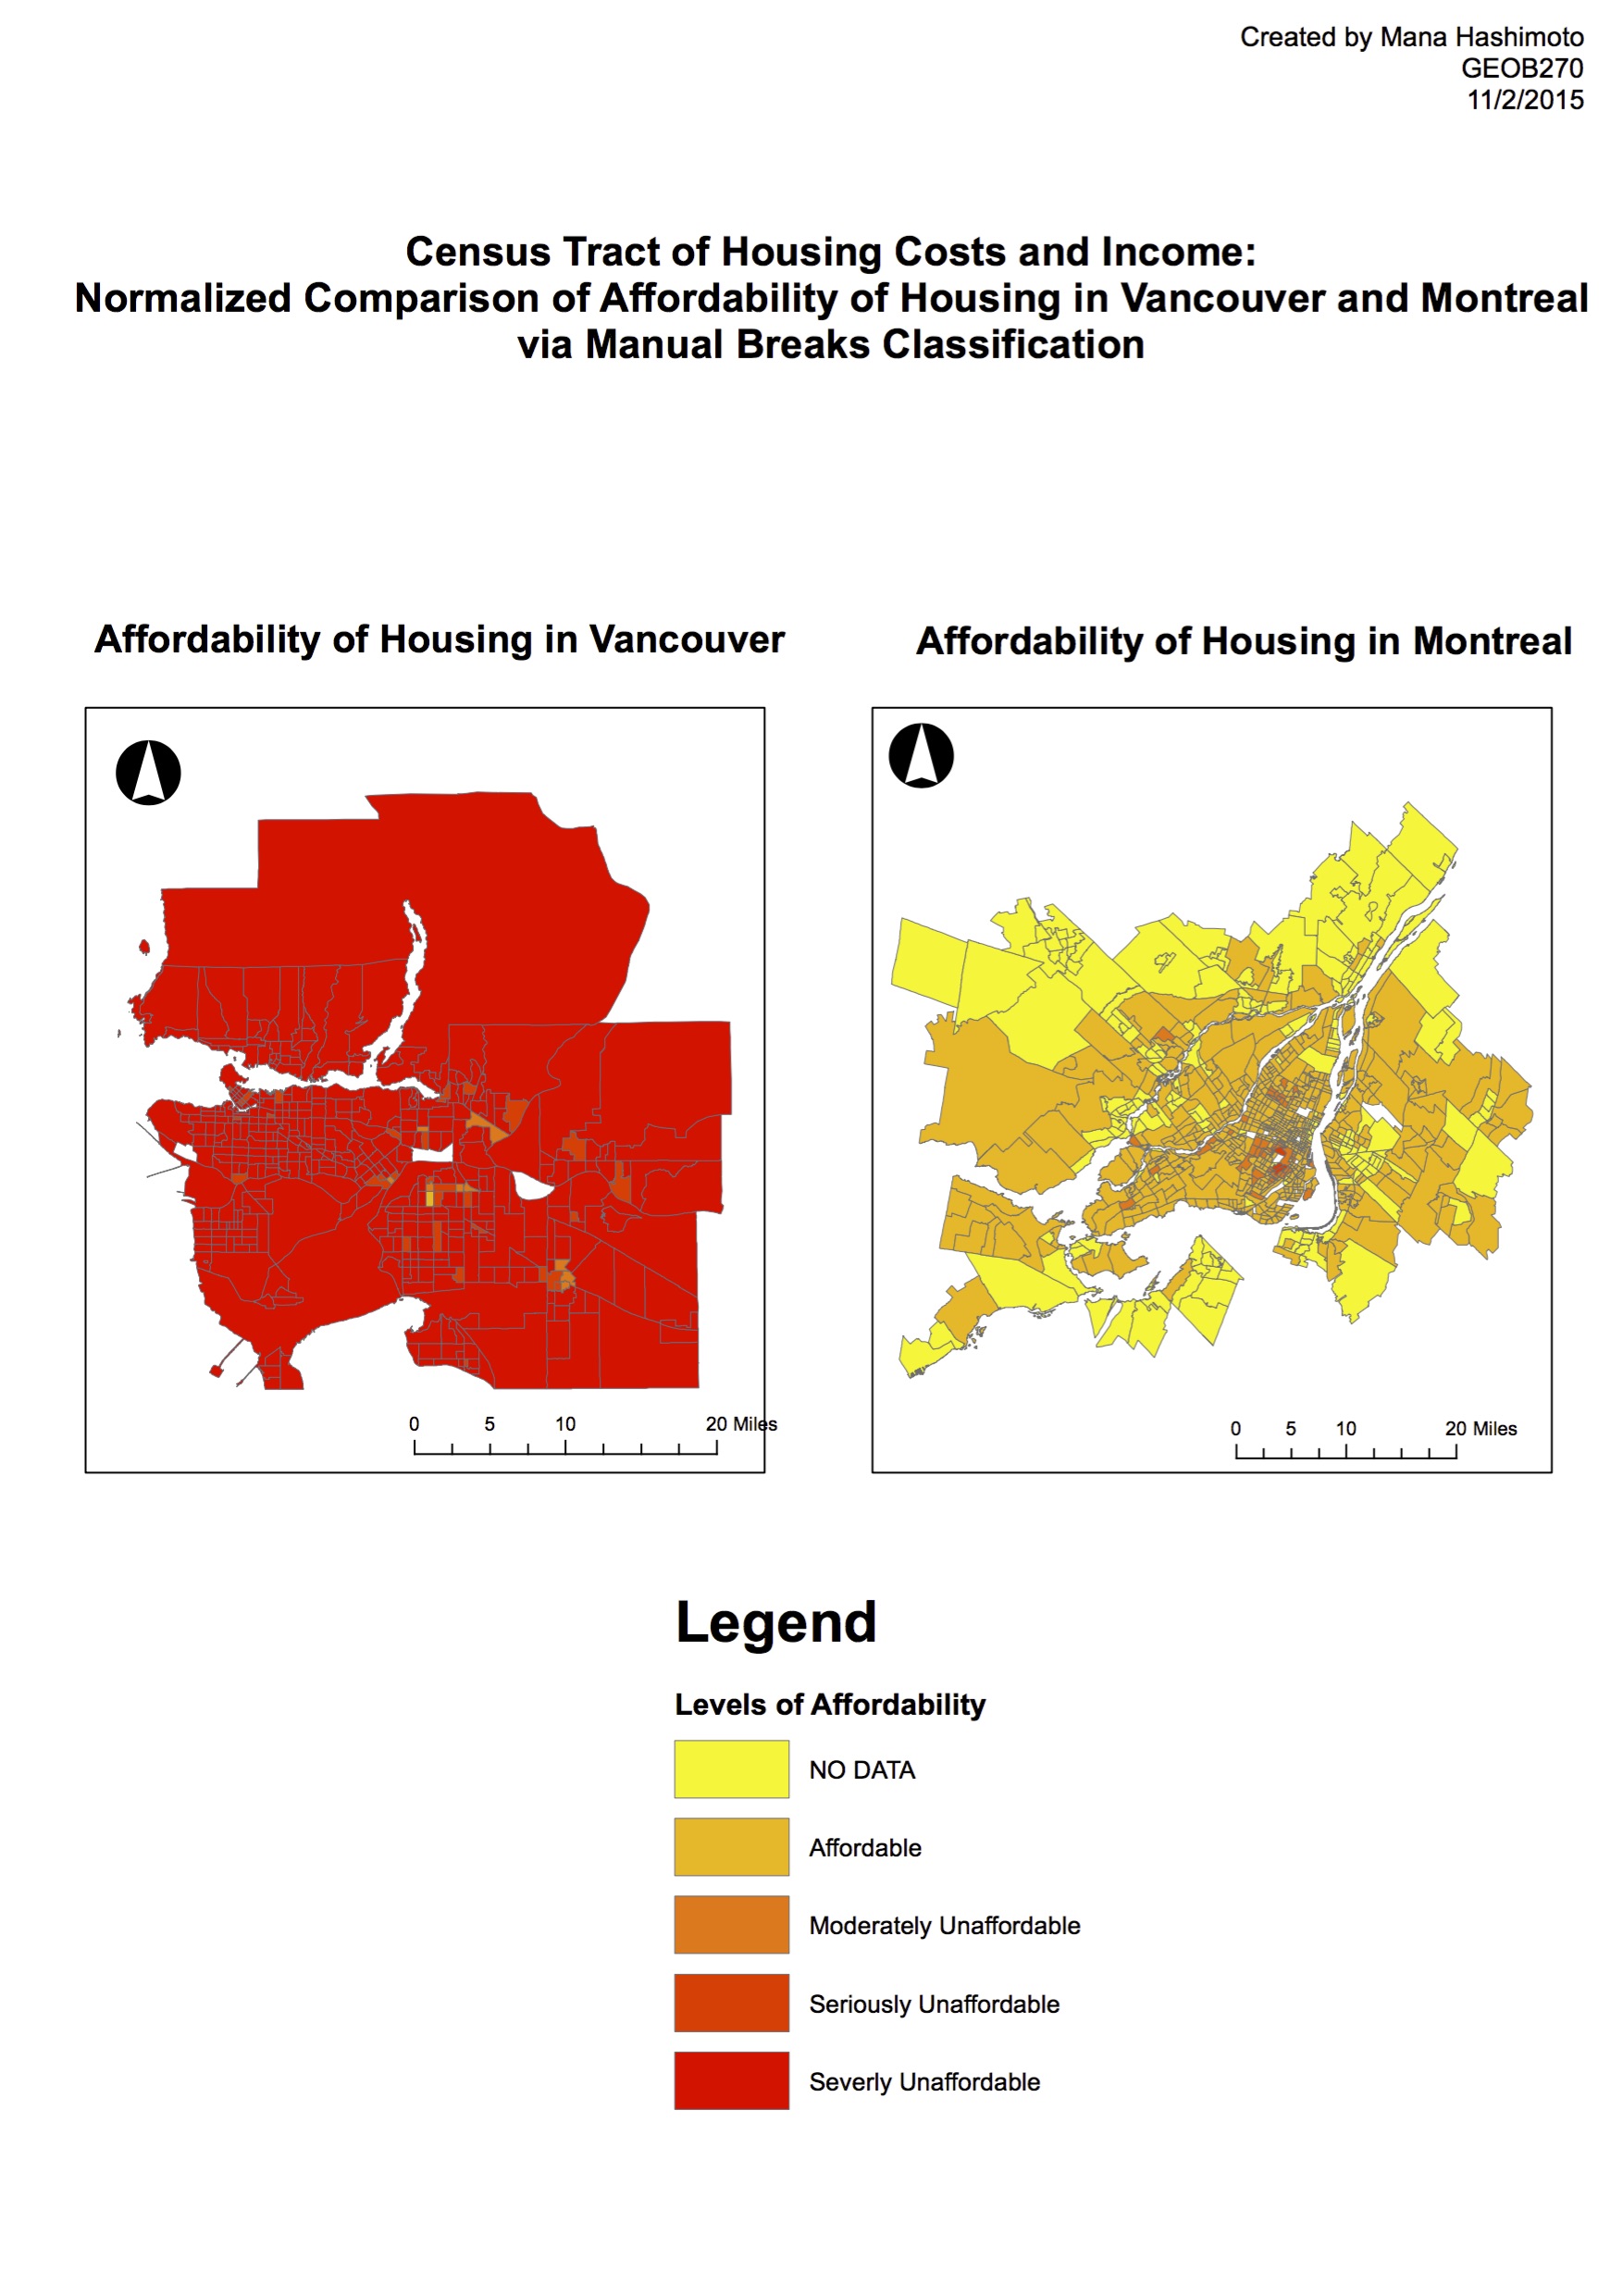
Lab 4: Affordability of Housing

  • Gained knowledge of where and how to find appropriate data.
  • Demonstrated understanding of quantitative classification methods and their impact on understanding information.
  • Generated a map demonstrating clear understanding of the ethics of data representation.

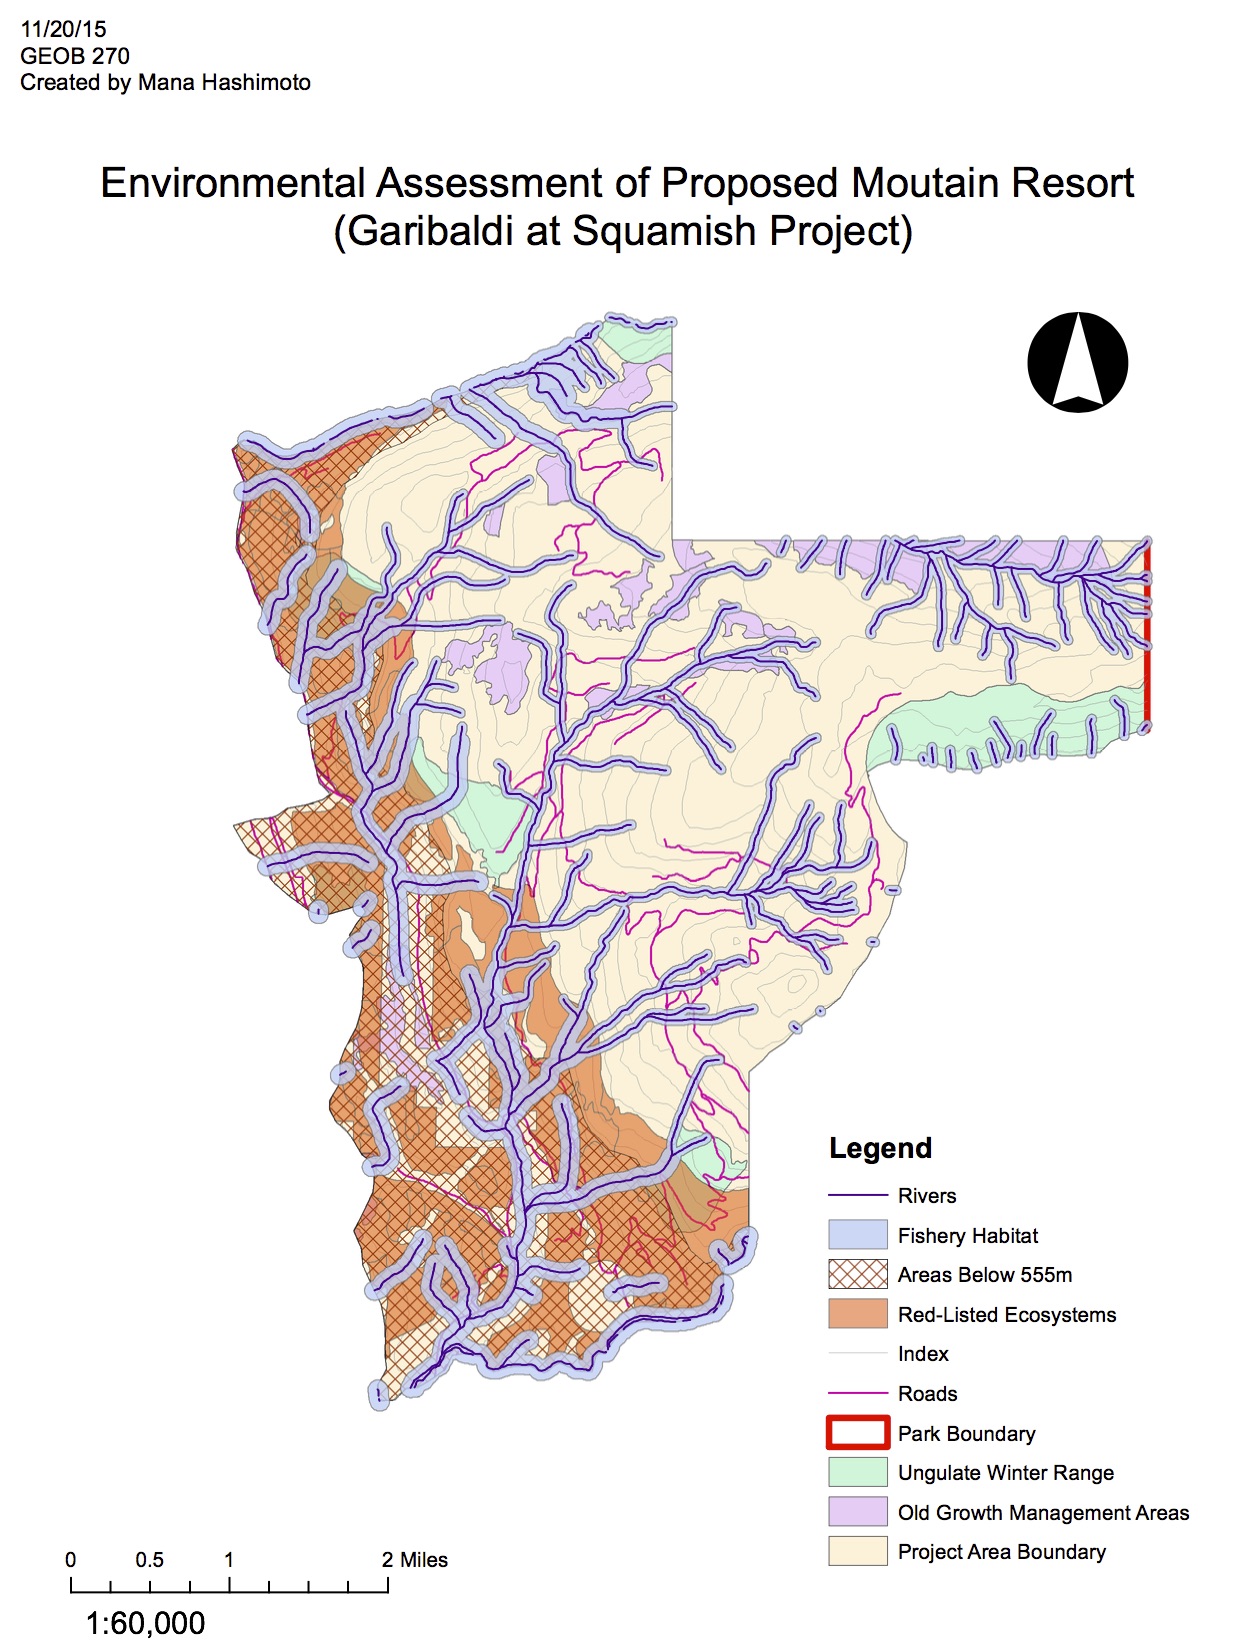
Lab5: Environmental Impact Assessment

  • Demonstrated resourceful capacity by independently locating appropriate data.
  • Productively utilized various geoprocessing tools in ArcGIS to effectively present data.
  • Critically evaluated the proposal of the ski resort effectively using the knowledge and information gathered from the analysis.


Individual Professional Development Reflection 

As a 3rd year Human Geography student this GEOB270 course has allowed myself to gain greater knowledge on the processes and significance of creating maps and visual representations. I have picked up practical skills in how to best utilize the GIS software available from the university, but also knowledge that is applicable to open sourced geoprocessing systems as well. I have also gained awareness in the critical implications of the use of image and data representations, and the issues of ethics surround the issue of representation. This course has also allowed me to realize the strength of teamwork, that allows to generate contributions that have can have significant influence. Through the team project I also realized the requirement of individual work ethics as well, in order to maximize the limited time with the team.


Final Project: Individual Evaluation

As a final project for GEOB270, we were to conduct a geographic analysis to investigate the reports made by the Agricultural Land Commission (ALC) about the Agricultural Land Reserves (ALR). Assigned the Skeena Queen Charlotte subpanel region of the ALC, our team worked together to recalculate the actual land suitable for agriculture in the project area (See attached completed report: An Analysis of the Skeena Queen Charlotte ALR Land). As a team of three, we assigned certain tasks to each other to maximize the efficiency of the work, but maintaining good teamwork as to support each other throughout the entire process. With my strengths in researching, I contributed by searching for the appropriate data required in the final project. I thank both my team members Rachel Maj and Claire Shepansky who contributed with great teamwork, and helped me out when I was struggling with my own tasks. I give particular credit to Claire Shepansky who helped the team progress with her strong knowledge with the GIS software and the science behind the work. Claire demonstrated excellent leadership and I feel she should be given much credit for that.

Through the investigation itself on the ALR in the Skeena Queen Charlotte region, I was very surprised by how little land is actually suitable for agricultural activities compared to what is reported by the commission report. In fact, with our subpanel region alone, over 18% of the reported ALR land was not viable for farming.

In doing the actual analysis, I gained greater understanding of how GIS and ArcGIS works, and became much more familiar with it than before. When working on the Roads layer, to combine the 6 different mapsheets, I became very familiar with re-projecting, merging, clipping, and then buffering the roads.

When first starting the project, we were lost to how we were going to actually divide the work, however we quickly picked up ways to distribute tasks by having one person in charge, and the other two supporting the one with the better understanding of the software. In that way, we were able to work quite efficiently. We struggled quite a bit to figure out away to safely share the data without losing or corrupting the files, but eventually figured out that we could work primarily through one team member’s account and transfer files to that account.

For our particular region of the Skeena Queen Charlotte, we struggled with the soils data retrieved from the Government site because there was a gap in our data that totalled to 12% of data was missing. Due to this, although we can make claims about the available data, we are very limited to make a clear conclusion about the entire subpanel region.


LAB 5: Environmental Assessment

lab5.1-2

The Garibaldi Lake project, is a concerning proposal because it is another example of the exploitation of the natural environment under the name of “job creation” and “economic expansion”. As one who is deeply concerned about climatic issues, I strongly suggest that this project to be stalled. There will be major disruption to the environment that could possibility enduring for decades. Not only so, but the creation will cause social conflicts such as land rights and traffic caused by construction and tourists. Located near Whistler, I personally don’t see a reason to have ANOTHER resort. The potential for any environmental disturbance is far more concerning than economic expansion at this point. Thus, the exercise where I had to write a supportive memo for this project was incredibly difficult to write, as I saw there were no viable reason for this project to proceed. It made me realize the power of language to make certain statistics to sound viable, when in reality they were concerning.

LAB 4: Housing Affordability

QUANTITATIVE DATA CLASSIFICATION:

dataclass(lab4)-2

When working with data, it is critical to be aware of the implications of how we present that data, and how we are manipulating it. Data can be easily influenced to support individual motives, and  thus can be concerning of how the data can put of context and mean something entirely different from what it was originally intending to represent.

For instance, if I were a journalist, since I would want to write up an article that would catch people’s’ attention, I would probably use the Manual Breaks Classification Method, as it effectively illustrates the narrative of an ‘overall unaffordable Metro Vancouver’.

But as a real estate agent, since I would want to present the region as more affordable, I would represent the area using the Equal Interval Classification because, relative to the other classification methods, the region is not categorized as the most costly region. Furthermore, compared to the Natural and Manual Breaks classified maps, the because it uses the colour red less, the Equal Interval map is easier to read without being overwhelmed.

Thus, there are major ethical implications for the quantitative data classification methods chosen as the data can be easily misrepresented to illustrate personal interests, rather than classification methods that would allow the reader or the buyer to make the best possible decision.


HOUSING AFFORDABILITY:

affordabilityVM (lab4)-2

  • Understanding the difference between Housing Cost, and Affordability
    • Affordability, is a measurement relative to the income of the region. Even if housing cost is high, depending on the average income of that region, that home may still be at an affordable price relative to the income.
    • Thus, a measurement index that compares average income with the absolute housing cost is a better indicator of affordability than just the cost of housing.
  • The Demographia International Housing Affordability Survey (DIHAS)
    • The housing affordability rating categories are based on the idea of the “median multiple” as suggested by the The Demographia International Housing Affordability Survey. The survey defines the median multiple as “median house price divided by gross annual median household income”.
    • The survey states that “domestic public policy should, first and foremost, be focused on improving the standard of living and reducing poverty” rather than “urban design or the physical layout of the cities” (9), indicating their clear purpose behind creating this indicator.
  • Is affordability a good indicator of a city’s ‘livability’?
    • Although the city of Vancouver has been recognized numerous times as the one of the best places to live in the world, the reality for many living in the city has been of struggle. Many citizens of Vancouver have continued to have a love-hate relationship with the city because they love the city, but they cannot afford to live in it and thus their experience of living in Vancouver is devalued. In these terms, a high ‘livability’ index does not always mean that citizens are all happy, and therefore affordability is a major criteria to measure a city’s actual ‘livability’.

LAB 3: Planning for a Tsunami

The City Vancouver has always been forewarned of a risk of a large scale earthquake due to its position on the Juan de Fuca plate and the North American Plate (City of Vancouver, 2014). The possibility of a major earthquake also raises concern for tsunamis. Although there is less of a concern for a tsunami to hit the coastline of the City of Vancouver due the geographic position of Vancouver Island which guards the city, it is good knowledge to be aware which areas of the city is most in risk of a tsunami. In this Lab, the areas at risk of a tsunami are addressed and mapped applying skills of spatial analysis, tables, and editing.


Lab3map_Hashimoto-page-001

Map of Areas at Risk of Tsunami in the City of Vancouver

  • Percentage of the City of Vancouver’s Total Area in Danger:
    • Utilizing the Statistics Tool available in ArcGIS, I calculated the percentage of the city of Vancouver’s total area under danger to be 11.3%.
    • The specific command syntax used to compute this value is as follows: [(Area of Vancouver_landuse_danger_intersect)/(Area of Vancouver_landuse)]*100.
  • Determining the healthcare and educational institutions within the Danger Zone:
    • To determine the healthcare and educational institutions located within the danger zone, I utilized the Intersect tool found in the ArcToolbox, to first intersect (Vancouver_danger) and (Vancouver_eduation), and then repeat with (Vancouver_danger) and (Vancouver_health).
    • As a result, I computed that there are five educational facilities, and four health care facilities within Vancouver’s danger zone.

Through the learning process of becoming resourceful with ArcGIS, I:

  • gained and demonstrated my understanding of maps and their implications of integrity and ethics with their projections.
  • productively utilized tools available in ArcGIS (eg. Statistics, Intersect) to articulate tabular and spatial data in the form of a visual representation (ie. a map).
  • generated a comprehensive map projecting the areas at risk of tsunami in the City of Vancouver.

Lab 2: Coordinate Systems and Spatial Data Models


◊How to Fix Misaligned and Improperly Reference Spatial Data:

When using spatial data to create a map, it is important to have data with consistent projection systems and coordinate systems. If the spatial data systems are inconsistent, it can cause the data to be misrepresented.

In the case they are inconsistent, fix the data by going to its Properties>XY Coordinate System, ​then selecting the coordinate system that is consistent with the other data.

If there is a layer with an ​‘unknown’​coordinate system, check the metadata or the original source of the data set to determine the coordinate system/datum that the data was created with.

Next, right-click the layer with the ‘u​nknown’​coordinate system and click Properties.

Finally, access the ​XY Coordinate System t​ab, then choose the coordinate system and datum accordingly to the information represented in the metadata.

Advantages to Using Remotely Sensed Landsat Data for Geographic Analysis:

Landsat Data is collected through recording the response time of sunlight, and then converting it into spatial data that can be mapped. Landsat Data is especially useful when examining changes on the earth when:

1.  the scope is so large that it cannot be recorded through human calibration equipment

2. when recording phenomena that is constantly changing, and therefore requires data to be captured immediately.

Under such conditions, Landsat Data is useful in recording natural events, such as the change in land-use after the explosion of Mount St. Helens, or when recording the transformation of the snow coverage in the Arctic.