In these exercises I learned to use ArcGIS to explore spatial map data of Canada and Washington State in the U.S. while learning about coordinate systems, datums, projections, and spatial data models (raster and vector data). I also learned how to use raster landsat data in the before and after of Mt. St. Helen’s volcanic eruption in 1980 in order to review the listed properties above.
We learned to read the metadata of shapefiles, layer files and raster data sets in order to give an idea of nature, quality and limitations in the data. Metadata is essentially the data about the data and it is a good idea to read the description tab before starting to work on the data base. Our professor described it as “garbage in, garbage out”, if the metadata does not show quality then the analysis of the data (the map) will also be unreliable.
We then learned to measure the distance between two points by using the Select-by-attribute function on the map of Canada, from Halifax to Vancouver. Which I found was 39.849922 Decimal Degrees or 4, 441, 732.917 Meters
Spacial Reference properties include the Datum, which allows GIS to locate each layer/region in its proper location in the world. ArcGIS allows data sets with different spacial data references to be displayed and aligned on the same projection. This function is called Projection-on-the-fly. I learned to use this function as well as how to change the projection manually by going into the ArcToolbox, Data Management under Projections and Transformations. I did this to align Canada’s lakes and rivers, major cities and national parks. This can be seen under the Table of Contents in the image below.
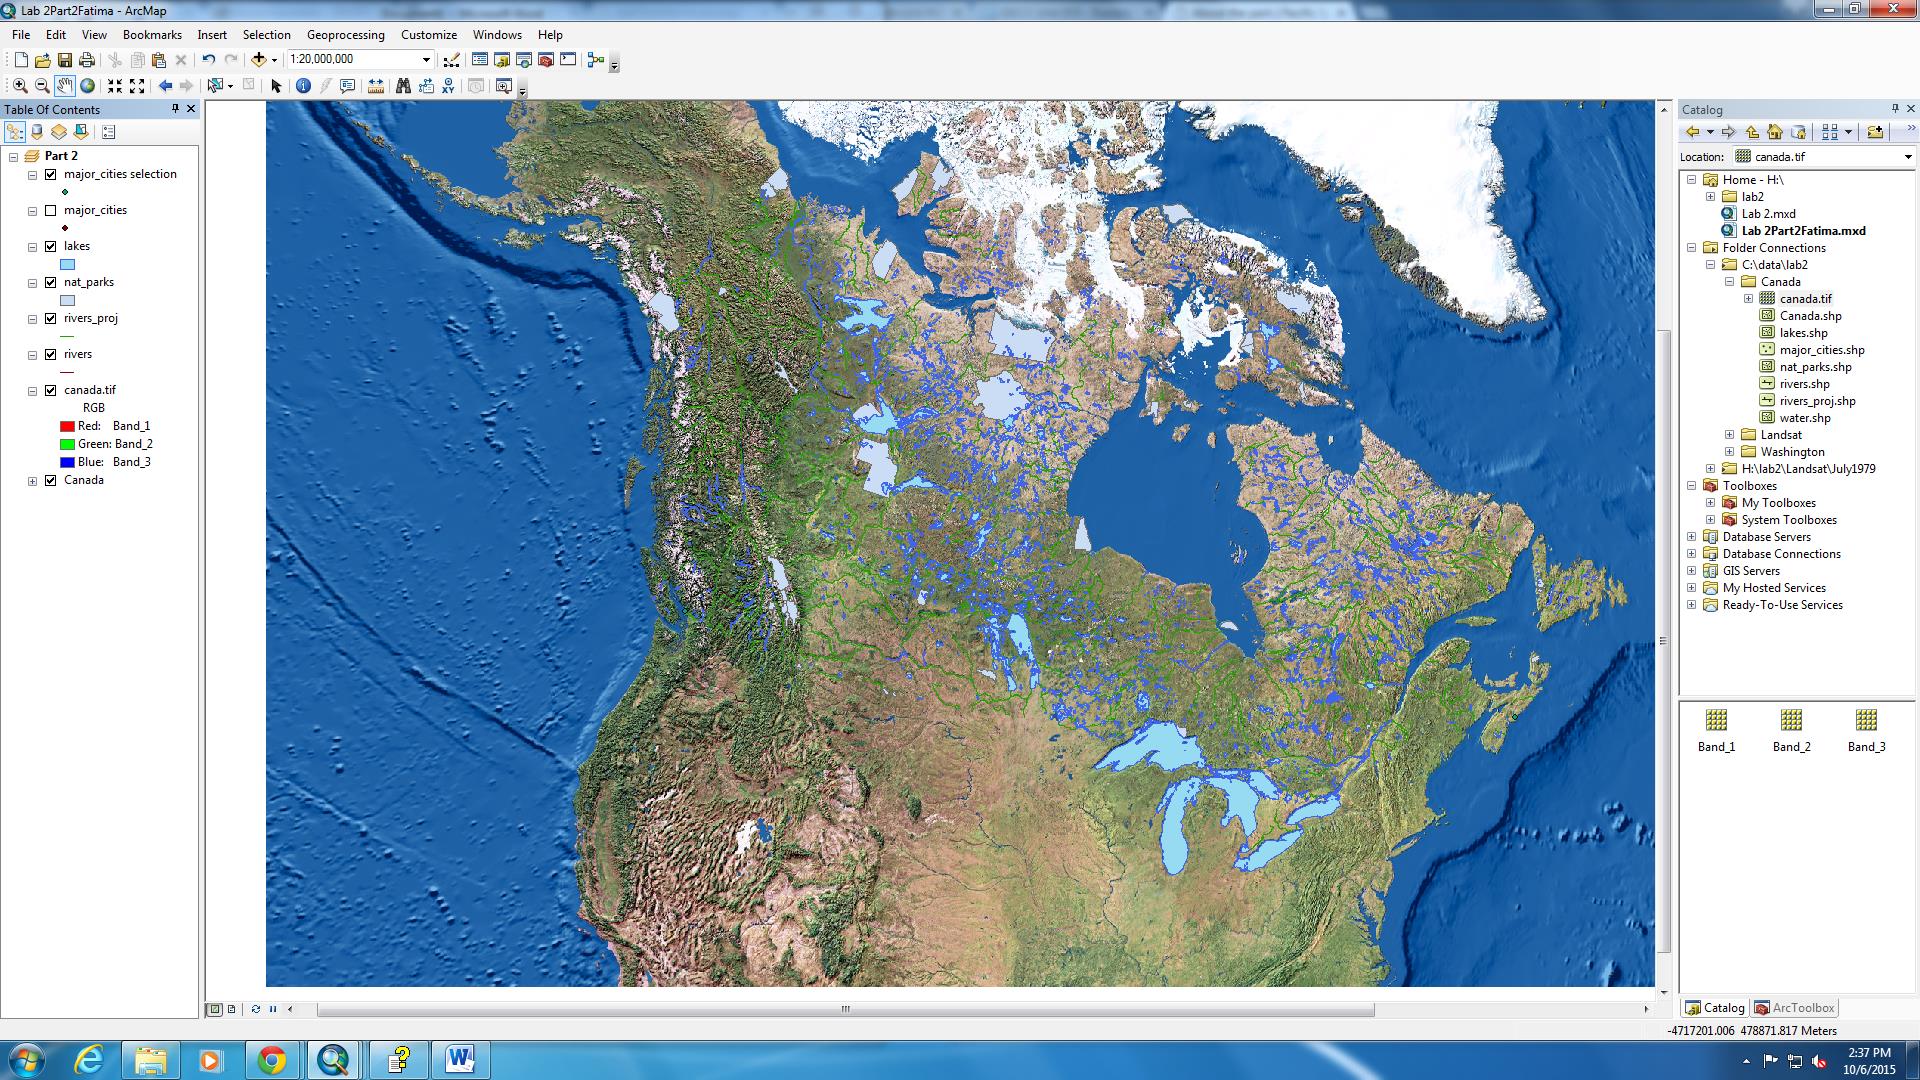
ArcMap Canada’s Rivers, Lakes, Cities and Parks all have different spacial references, but they have been aligned using ArcMap
In class that week we learned about Great Circles. Great Circles are widest possible circle that could be made with a sphere. This is the exact mid-point of a sphere because it creates the largest ring around it. An example of this is the Earth’s Equator. It is the exact mid-point between the North and South Poles. According to the National Geographic “Great circles are also useful in planning routes. The shortest path between two points on the surface of a sphere is always a segment of a great circle. Plotting great circles comes in very handy for airplane pilots trying to fly the shortest distance between two points”. The shape of the Earth is not perfectly spherical it is slightly flattened on the poles, this makes it even harder to be projected into a 2D surface. Maps are 2D interpretations of the Globe which is 3D. When the data is projected into a different coordinate system distance, area, and the angles of points on the sphere are also affected.
Spatial data is normally grouped into two types of data structures: vector and raster data. The type of data structure used also affects the type of calculations and operations that can be performed on a given layer. The raster data model represents the world as a regular grid of cells also known as pixels. This type of structure works well when you are dealing with phenomena that exist throughout a space and do not necessarily have distinct boundaries. Raster layers are frequently used to symbolize temperature, elevation, rainfall and similar type of phenomena. In the image below, I have used rastor data model to calculate the area of the three types of land covers.
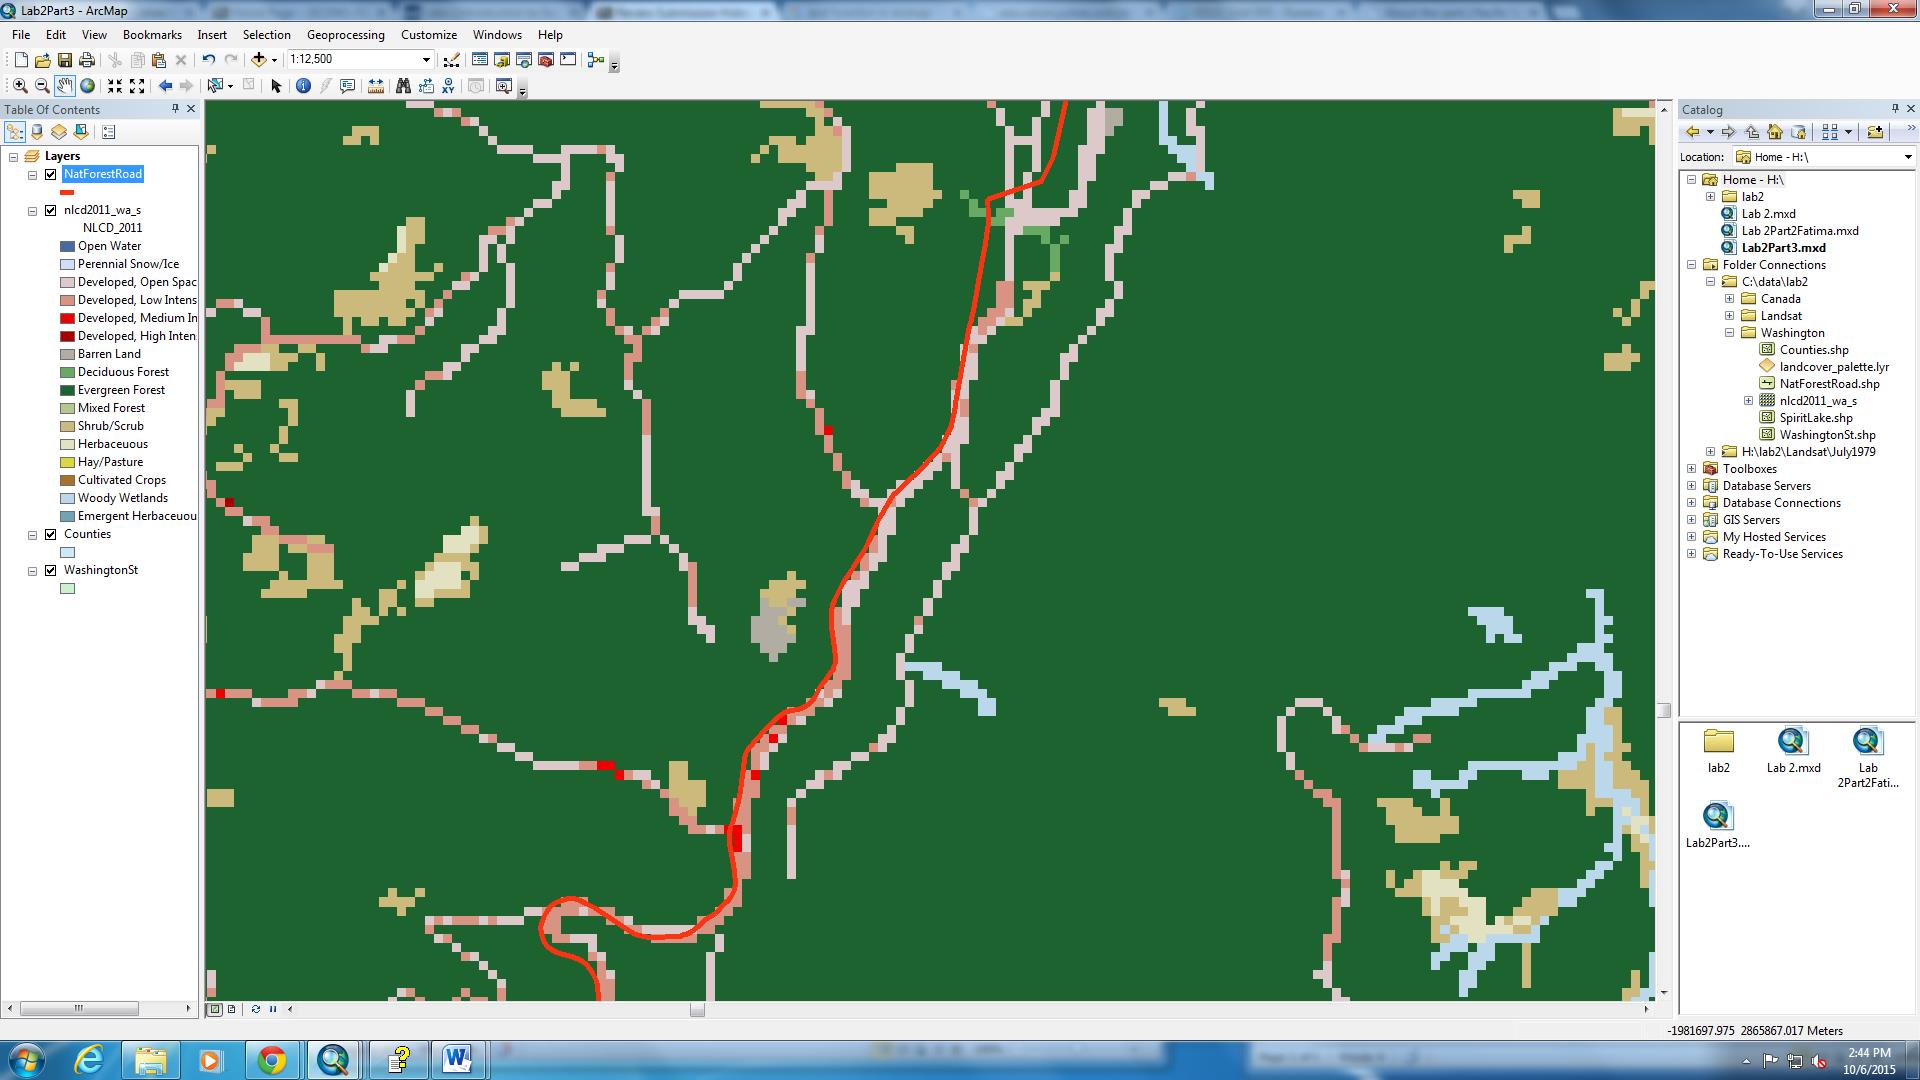
Land type and Area: Evergreen Forest 4755 km2 Shrub/Scrub 1438 km2 Herbaceous 391km2
Working with Remote Sensing Imagery
Landsat is a remote sensing program that has been continuously scanning earth since 1972. It uses sunlight as its energy source and measures the response of objects and surfaces on earth. There have been new satellites launched with better sensors as technology has evolved, culminating on Landsat 8 currently in orbit. Landsat can scan the same area of earth every 16 days. In the exercise we examined the changes Mt. St. Helen’s 1980 explosion had on the surrounding landscape. In the image below shows the change in the size of the lake near the volcano from 1979 to 2002.
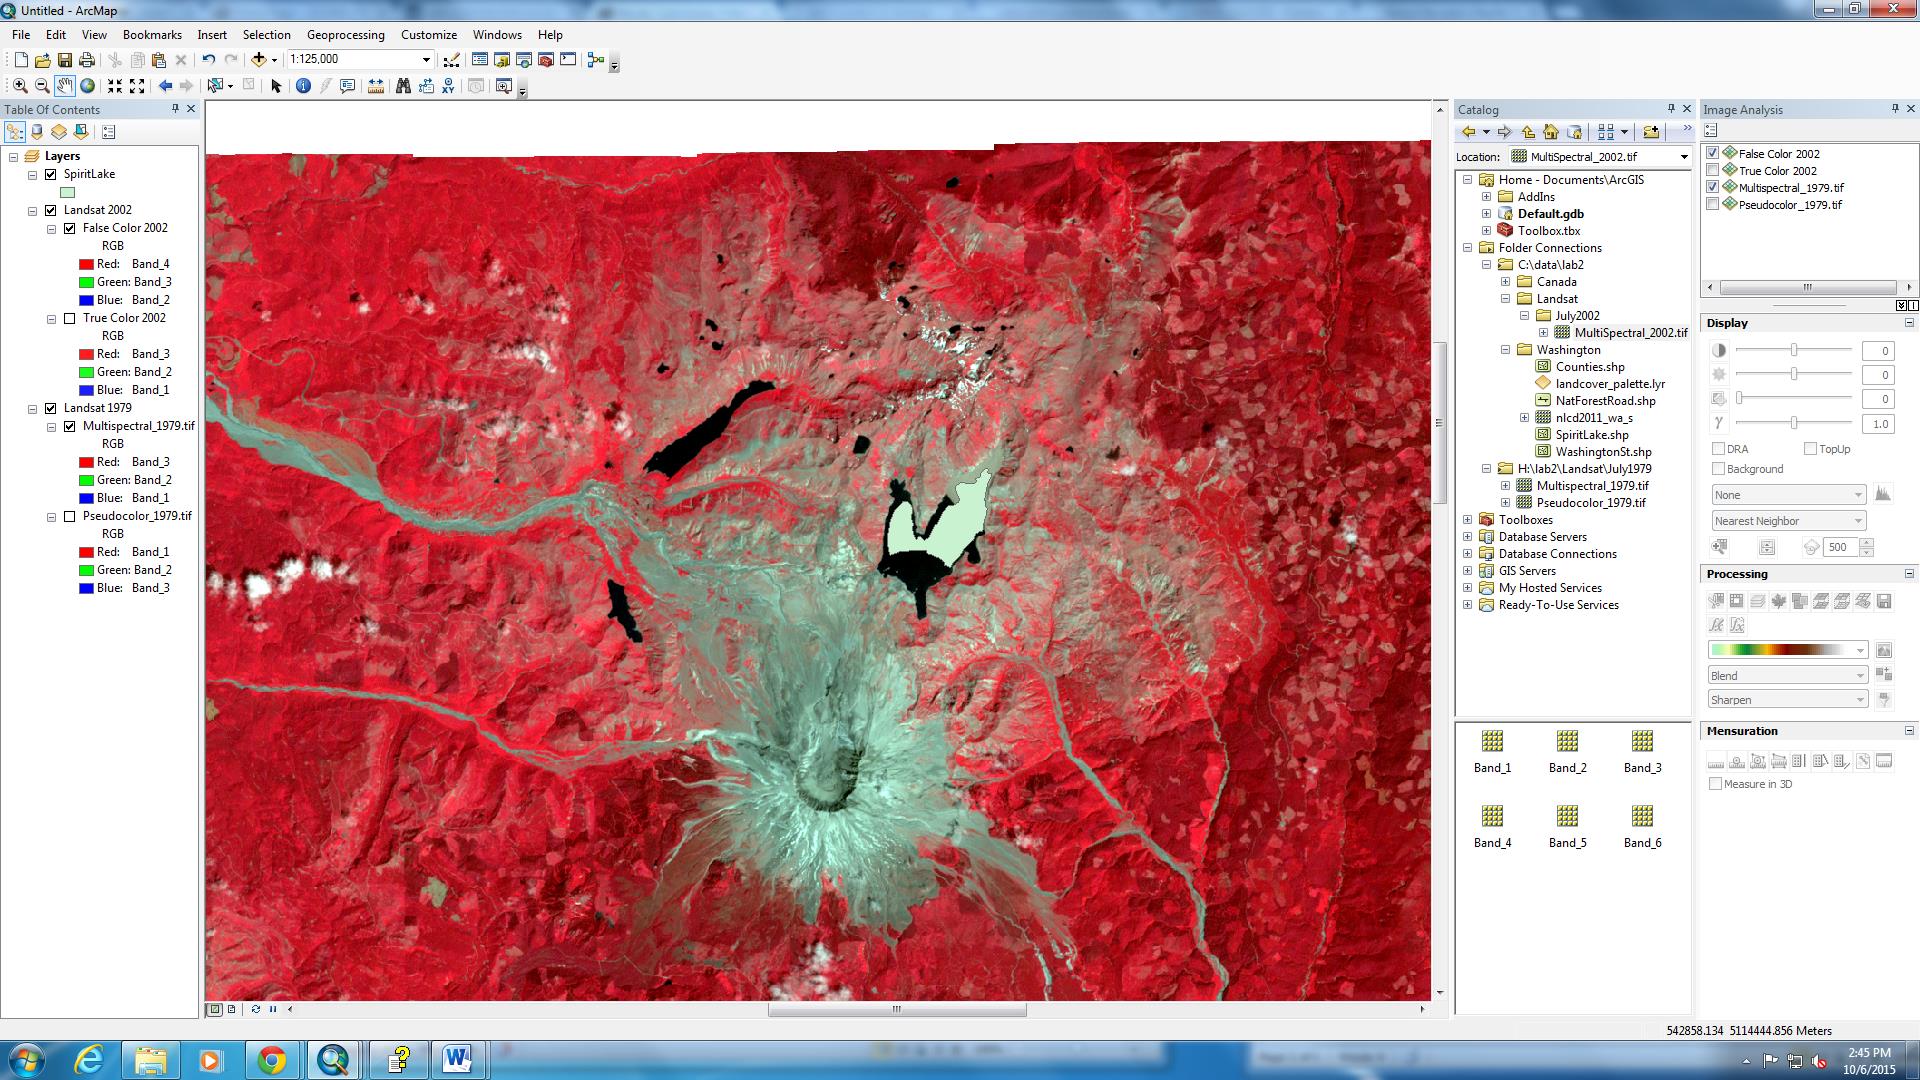
Mt.St Helena explosion affects on SpiritLake 1979 data in comparison to 2002 data.
Landsat data could also be used to see the change in the lake area over time. A good research question would be; By how much has the size of the Aral Sea in Central Asia changed each year from March-April since 1928, (or since the beginning of the Soviet Union) till present day in 2015? Data should only be collected every-year in the same seasons. Since the Aral Sea is a lake, it is prone to shrink during the dry season with high evaporation rates, and expand during winter for the opposite reason. So data should be collected at the same time on the year for more accurate results. As I continue to study geography, in the future I would like to work around the research and management of the Aral Sea Basin. And ArcGIS would be a good tool to visualize this work.