
Even though, U.S. government shutdown ended with a new budget agreement, monthly reports of USDA for Oct.14 were canceled. Some traders may wait and see until report updates. Then, you miss the chance. This bullish week (especially soybeans and corn) largely depends on speculation that China has boost purchases from U.S. In my perspective, previous expectation on increasing demand from China (because of the flood) seems to be proved. However, I am not sure whether this two events are likely to be directly connected.
What did I do?
I decided to step out of safe zone, heavy positions are taken. I took 20 contracts of corn DEC, 10 contracts of corn MAR and 10 Soyoil DEC on Oct 14. The main reason for I do these transactions are (1) amortization of cost (2) higher demand expectation
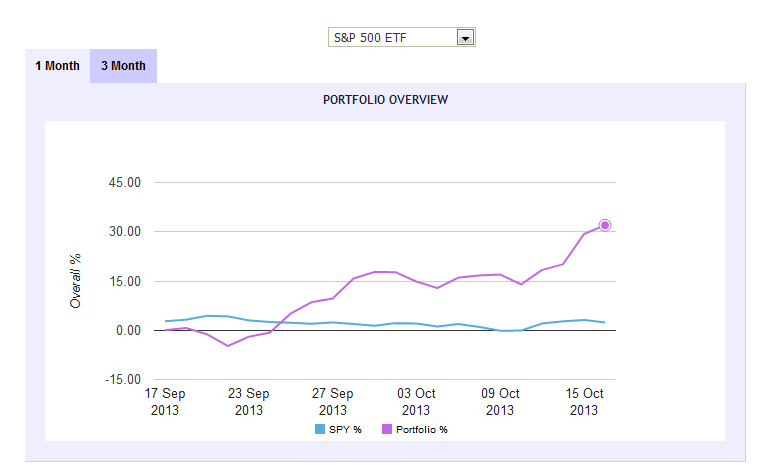
Most of my long position are for diluting my cost. I bought 20 contracts of corn DEC at 4.35 which is below my previous cost 4.41 with 5 contracts. For Soybean oil, It nearly bottomed to starting value,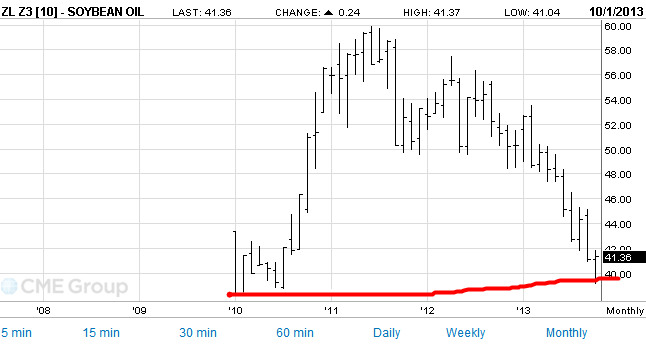 I bet it may rebound in response to expected Chinese demand. And I won about 15000. Below attached my portfolio summary till now.
Why did I turn to technical analysis this week?
I define myself a kind of person who believe macro economy impact and long term observation more. Because I think I am really not that kind of smart guy who can remember so many kinds of lines and play them around with a breeze. Honestly, candlestick methodology is still a mess in my brain. For previous personal experience, candlestick chart is a basic tool traders should grasp. Another anecdote is that I quit leaning investment when I was taking my master degree of China because of being afraid of K-line, red and green numbers and so on. I even scared to talk about my finance background for I have never done any transactions in any financial markets, at that time, I have learnt Finance for seven years. Absolutely, loser!
Back to the theme, however, technical analysis could help you to earn quick money and fit for short-term speculations. So I immersed myself a little into some shallow and simple technique tools. Still step away from K line (candle stick chart)!
Technical kits—part 1
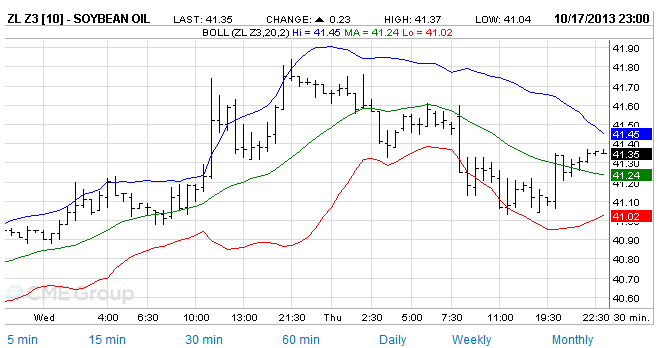
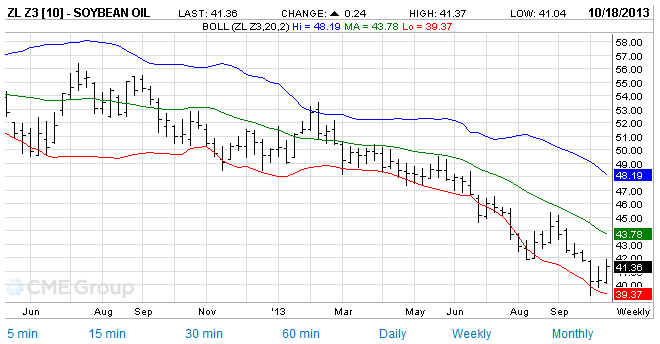
Bollinger bands: it is used to measure the highness or lowness of the price relative to precious trades.it consists of an N-period moving average( familiar?) , an upper(lower) band at K times an N-period standard deviation above (below) the MA. A conventional interpretation is Bollinger bands are indicating an overbought market. An overbought reading occurs when the close is nearer to the top band that the bottom band.
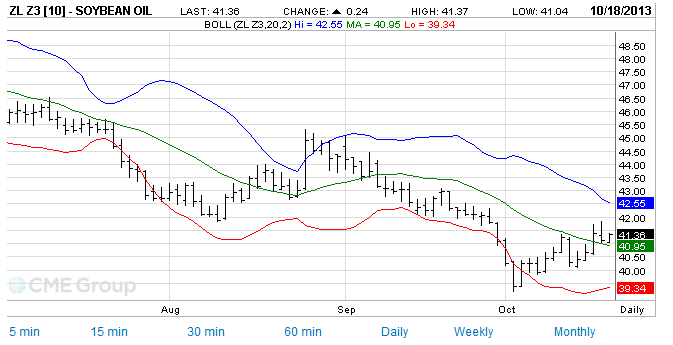
Below graphs depicts bollinger bands of soybean oil DEC 30min, daily ,weekly.In 30 mins short-term graph, soybean oil turned out to be an overbought market. Whereas in daily, the overbought features weakened. Market inverse in weekly graph.
Moving average 3 lines indicators: in evaluating the shorts term, MA(4) plots represents the fast moving average, and MA(9) plot is the slow moving average. For the longer term analysis, MA(9) is the fast moving average and MA(18) is the slow moving average. From short term perspective, corn market is bullish because the fast moving average is above the slow moving average.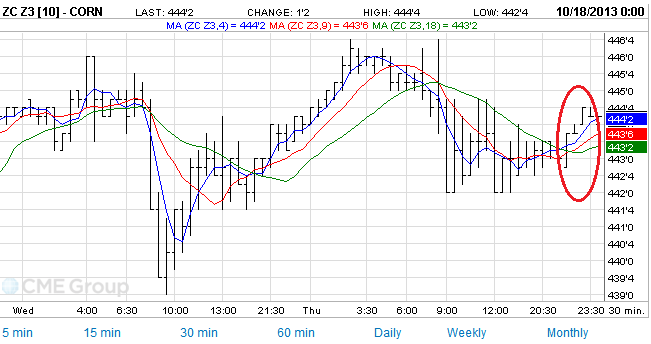
From long term view, the market is bearish because the fast moving average is below the slow moving average. So it may be a warning that the bullish situation of corn would turn someday, so be care of heavy position and be prepared to for risk exposure!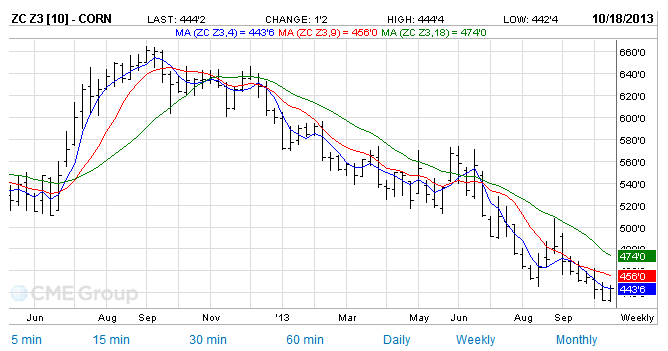
To be continued….