Fish catch policy in Japan

Fish in Japan is a rather particular nature. Fish is an essential part of Japanese daily life. A strong demand for fish is particularly pronounced in Japan. The fish in national diet is a good example, (Carl-Christian Schmidt, 2003) Per capita supplies of fish and fish product in Japan is estimated at 70.6 kg per year compared to a world average of 15.0 kg. Correspondingly, Japan has really huge fish catch for supporting domestic consumption. Japan harvested a total of 6.25 million tons of fish to a total value around 11 billion USD, which made Japan the second largest producer in the world. Interestingly, Japan’s fisheries production doesn’t continuingly increase with the (FAO) growing human consumption. In 2009, Japan’s fisheries production volume was 5.43 million tons, which is about half the peak volume in 1984. Not only Japan, but every fish production and consumption countries in the world face the dilemma: How to ensure both the sustainability of fish resources and stability of fish supply? Probably, I can’t give the answer in this blog. But it is quite worthy of studying the fish catch policy in Japan which is well-known for its coastal community based fisheries management and its approachs to sustain fish resource.

Fish catching management methods in Japan

In the White Paper of fishing in Japan, it states three resource management methods to protect fish from overexploiting in Japan: input control, technical control and output control.

The input control is the fishery permission system which controls the quality and quantity of fisheries operation, i.e. restrict the number of vessels, the engine power of vessels and operating periods, etc. The technical control regulates the ways of operation, such as, the maximum net mesh size, the banning on spawning period and establishment of protective zones. In the language of what we learnt in 525, these two methods could be understood as controlling of “effort”. The fishery permission system and operation regulations raised the cost of efforts of fishing, so that curb the excessive inputs of overfishing. However, as fishing is open access resource, it will definitely be profitable in the terms of no COGS (Cost of goods sold) but expenses (“effort”), fish catchers have enough incentives to pursue profit as they only pay for expense. Even, under technical control, the technical development in fishing would offset the effectiveness of policy. Hereby, output control is quite important and Japan executes Total allowable catch (TAC).

The TAC system directly manages the catch of specified species with the upper limit of total catch in tonnage. Currently, TAC apply to eight species. Research ship surveys of the seas are conducted every year to assess the status of fish stocks. Fisheries Research Agency makes recommendations on the total catch amount based on the stock assessment and socio-economic conditions of the fishery type. This method is actually the disaggregated quota that we learnt. It helps to retain the fish resource and solve dumping problem under high effort cost. Specifically, with disaggregated quota, the revenue maximizing legal landing equals to the quota for each type of fish. Given the technology level, if the price of effort is low enough, fisher will discard the cheap fish and retain expensive fish. If the price of effort rises, ideally no dumping occurs. If the price of effort increases further, then the quotas no longer bind. In the case of Japan, although the TAC is quite information intensive, I believe the TAC system works well in terms of retaining fish resources and solve dumping problem. Because the input control raises the cost of effort to a really high level. Besides, (Mitsutaku Makino, 2011) Fishes and their organizations play a core role in the Japanese fisheries management regime, in both resource and ecosystem conservation. So, Japanese fisherman has a high self-awareness of sustainable fishing.

Mitsutaku Makino exposed an interesting data (shown in below table) in his book “fisheries management in Japan”: the real amount of catch in Japan is far below the TAC. I am really interested in the reason of the gap, however, they are not demonstrated in the book. Is it because of the overestimated TAC, effectiveness of input and output control or the economic inefficiency of fishing sector??

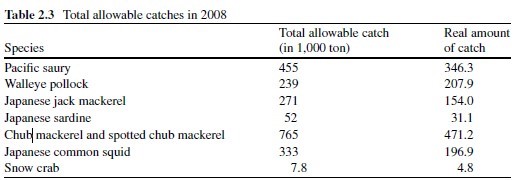
Resource: Mitsutaku Makino, fisheries management in Japan: its institutional features and case studies. 2011

Hot repute on fisheries reform

In 2007, a policy report published by an influential think tank suggested dozens of specific policy measures to be implemented by the Japan national government. Several measures have sparked heated debate within the fisheries industry, academics and the government. One point is to introduction of Individual Transferable Quota system to abolish entry barriers to fisheries and made it open to anyone. Actually, Japanese fishers have autonomously introduced IQ, but not explicitly defined ITQS. But the small-scale fishers and processors, spoke out strongly against the report, especially the coastal fisheries open and adoption of ITQ.

The ITQ is similar with the cap-and-trade in carbon emission reduction policy. It is the freely transferable of TAC. The participants can sell the rest part of their unused quota to others. The gap in above tables maybe because of lack of the ITQ, i.e. fishers can transfer the abundant quota. If the quota is fully used, it could be contribute to increase the supply for satisfying the fish production consumption in economic and sustainable way.

However, the small-scale fishers and processors who strongly against claims that decline in the economic efficiency of the fisheries must be addressed, but not through the unrestricted entry of large companies from outside local communities. The adoption of ITQ would destroy these historically established verified systems, and would change the fisheries sector into short-sighted profit-pursuing industry.

Conclusion

We could see that the effectiveness of fish resource management methods in Japan deserves to be highlighted in terms of overcome overexploiting and dumping problem. We always concern about the overexploiting of fish, however, this is not the case for Japan. Its biggest problem is gradually less competitive with other countries in fish catching and the economic inefficiency in fish sector. The fish reforms may aim to solve this problem, but we couldn’t deny that there are profit pursuing incentives. To balance the increasing demand and sustainable supply is always hard. Especially, the fishing policy is not the simply economic problem, but intertwine with political concerns. In Japan, if the “economic efficient” policy shakes its community based fisheries interest, we could understand why fishers say “No”.


Reference:

  1. Mitsutaku Makino (2011): Fisheries management in Japan: its institutional feature and case studies. Springer
  2. Matthew A. Turner (1996): Quota-induced discarding in heterogeneous fisheries. Journal of environmental economics and management.
  3. OECD: Fisheries of Japan: fisheries policy outline for FY2011. White paper on fisheries
  4. Carl-Christian Schmidt (2000): Fisheries and Japan: a case of multiple roles?

Carbon tax in Finland

Carbon taxes have existed for nearly 20 years in the wold. It is firstly emerged in Finland in 1990s. The tax rate is $30 per metric ton CO2. Originally, the carbon tax is based only on carbon content, it subsequently evolved to a combination carbon/energy tax. Direct statistical data about carbon tax is currently unavailable in Finland. According to Statistics Finland, tax types are listed as energy taxes, transport taxes, emissions taxes and resource taxes. In 2011, total environmental taxes levied are 58.353 EUR billion. 2/3 of total sum of environmental taxes are energy taxes on electricity and fuels. Nearly 1/3 are various transport taxes levied from vehicles. The 2% emission taxes are mostly waste taxes.  [1]From industry aspect, the energy taxes are mainly from household, land and pipeline transport and oil refining industry.


Motivation and Goals

From the common sense, the purpose of the carbon tax is to curb the emissions of GHG, the massive stock of GHG results global warming and initiates extreme weather events. Well, except for the noble goal, the other is initial purpose is revenue collection for government. The Ambassador of Finland Anne Lammila said the motivation for Finland to create a carbon tax is ‘to get more money for the government because Finland economy collapsed for the reason of collapse of the Soviet Union at the beginning of nineties. On the other hand, the oil crisis makes deeper understanding of policy motivated by environmental aspects.’[2]

As a member of EU member states, Finland committed under the Kyoto Protocol to bring annual GHG emission down to their 1990 level in 2008-2012 period. From period 2013-2020, Finland supports EU’s commitment which pledged an EU wide quantified emissions reduction to bring emissions to 20% below 1990 level. [3]The energy strategy and climate strategy of Finland intertwines. Its revised long-term Climate and Energy Strategy in 2008 defines the principal objectives and means of Finland’s climate and energy policy for the next few decades, within the contest of the EU. In 2009, Finnish government adopted the Foresight Report on Long-term climate and energy policy to supplement the longer-term ambitions of the 2008 strategy. The report outlined possible paths to low-carbon Finland by 2050. It sets a target for Finland to reduce its GHG emission by at least 80% from 1990 level by 2050. [3]

Carbon tax/energy tax and EU-ETS

The IEA report claims that the increase in Finland’s emissions by 2050 is almost entirely due to emissions from sectors covered by the EU-ETS sector. The EU-ETS is a mandatory cap-and-trade system established for limiting emissions from energy and emission-intensive sectors. The missions trading sectors includes coal, peat-fired power plants, district heating, oil refineries and energy-intensive industry sectors. Their emissions accounted for 52.4% of total national GHG emission in 2011.  The 47.6% Sectors or activities not covered by the scheme should be dealt with energy or carbon tax.[4] Industry like transport, buildings and agriculture, small industry and waste are subjected to rising tax supplemented by a range of other polices.

Carbon tax implementation

The carbon tax of Finland experienced a series of adjustments and explorations. A technical report of National Renewable Energy Laboratory of the U.S. Department of Energy office in 2009 [5] notes that at the beginning of launch, Finland’s carbon tax is separate component of tax levied on fossil fuels for transportation or heating, it applies to gasoline, diesel, light fuel and heavy fuel oil, jet fuel, aviation gasoline, coal and natural gas.  Commercial vessels and commercial air traffic as well as fuels used for electricity are exempt. The rate per kWh for electricity does not vary according to carbon content, however, a refund is applicable for renewable electricity. We are also informed that Finland’s carbon tax was initially based on carbon content, it was modified to include a 3/5 carbon component and 2/5 energy component. The energy tax was based on energy use in Mega Watt hour rather than on carbon content of fuel. Starting from 1997, Finland returned to a pure carbon tax. The carbon tax was most recently increased to €20 per metric ton CO2 on January 1, 2008.

The International Energy Agency mentioned tax reform of Finland in its 2013 review of energy policies of IEA countries[3]. In 2011, the government changed the structure of energy taxes on fuel for transport and heat and power plants. The taxation includes the energy content, CO2 emissions and particle emissions that have adverse health effects.  In 2011, an additional EUR 730 million was collected in taxes on fuel for heat and power plants, and energy taxes on electricity. In addition, tax on natural gas is to be increased. Peat is now subject to a tax. The weight of levies on carbon dioxide has been raised from their 2010 level. Biofuels which meet the sustainability criteria will be levied carbon tax, but a flat-rate tax reduction of 50% is applicable. The biomass originated from waste and residues, non-food cellulosic and lignocellulosic materials is completed exempted from the CO2 tax. The CO2 tax does not apply to wood and other biomass used in the production of energy. From the start of 2011, carbon tax for fossil fuels used in combined power and heat production were lowered by 50%.

Distribution

Tax revenues could be used to achieve socially desirable objective. The revenue collected through carbon tax is distributed to compensate government budget accompanied by independent cuts in income taxes. The tax-shifting packages could mitigate the regressive impact of carbon tax or cap-and-trade program (disproportionately affect low-income households). Furthermore, tax-affecting firms and sectors may desire compensation for the loss of profitability and assistance in addressing competitiveness concerns.[6] A concern is that the tax burden may weaken the competitiveness of Finish companies.

Cost effectiveness evaluation

One of the most rudimentary metrics for measuring carbon tax effectiveness is overall reductions in GHG emissions that can be tracked.[5] According to Prime Minister’s Office, Finland (2000), emissions were 7% lower in 1998 than they would have been without a tax. Also, the impacts of programs funded by specific carbon mitigation measures can be quantified to determine program effectiveness. With such program evaluation, governments administering carbon taxes can change the rate or shift funds to program that are more effective at reducing emissions.  [5]


Reference:

Reference:

[1] Statistics Finland. (2013, Sept). Environmental taxes 2011, by industry.

https://www.stat.fi/til/yev/2011/01/yev_2011_01_2013-09-26_tie_001_en.html

[2] YouTube. (2013, Nov). Carbon tax works in Finland

https://www.youtube.com/watch?v=8j5gop745ek

[3] International Energy Agency. (2013). Energy Policies of IEA Countries-Finland-2013 Review

http://www.iea.org/Textbase/npsum/finland2013SUM.pdf

[4] National Treasury, Republic of South Africa. (2013, May).Carbon Tax Policy Paper.

http://rfflibrary.wordpress.com/2013/05/02/carbon-tax-policy-paper-reducing-greenhouse-gas-emissions-and-facilitating-the-transition-to-a-green-economy/

[5] Jenny Sumner, Lori Bird, Hillary Smith. (2009, Dec).Carbon Taxes: A Review of Experience and Policy Design Considerations.

http://www.nrel.gov/docs/fy10osti/47312.pdf

[6] Pew Center, Global Climate Change. (2008, Fall). Tax Policies to Reduce Greenhouse Gas Emissions.

http://www.c2es.org/federal/congressional-policy-brief-series/tax-policies-reduce-greenhouse-gas-emissions