London Congestion Charge

      There are always economic logic behind the policy which aims at solving traffic congestion.  Firstly, people come up with solution from supply side. One example is the insufficient of road supply, thus the projected policy is building more roads, more bridges and more overpasses etc. Secondly, the answers from city landscape planning. New cities are planned as net structure with dense road, including arterial road and capillary road. Besides, it is believed that highly developed underground transportation system could ameliorate ground traffic. The logic is right: wider roads, more overpasses, more reasonable layout of the road structure, more developed subway and less traffic congestion. But increasing supply triggers more demand. As the road, like fish is open access resource which is free to use. The more convenient, cheaper to use, the more negative spill-over effect will be. Lastly, we turn our view on demand side, such as limitation on car purchasing, the auction or lottery of car number plate, restricted driving policy based on number plate digits, staggering the peak hour and lifting parking fee. The restriction on private car purchasing only delay the increase of private car, but not decrease the volume. Similarly, the limitation on car usage will not affect as people will concentrate the usage on the days without limitation, or many household began to buy second cars. The parking fee and staggering the peak hours will not solve the congestion essentially as road is free to use. Of all the polices, the congestion fee may be more effective as it raises the cost of using road, as the road is no longer an open access resource, market mechanism will work to solve the over demand of road. In addition, the ideality in theory is not always effective in practicality. Here, let’s start from the classic congestion policy case—London Congestion Charge.

How does the congestion charge work in London?

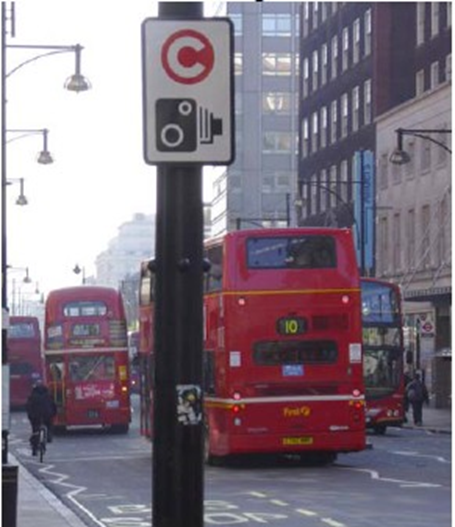
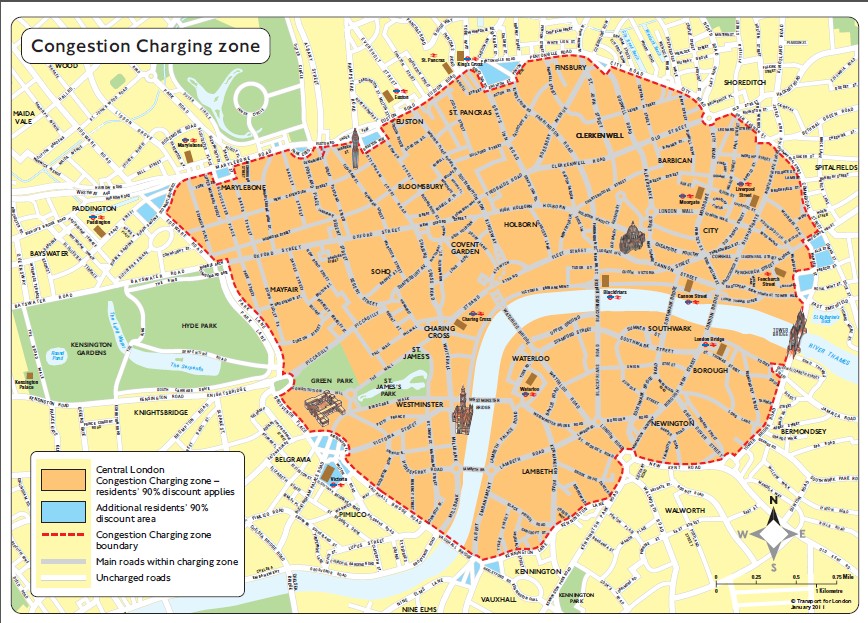
     Currently, the Congestion Charge is £10 daily (standard) for driving private and commercial vehicles on public roads within the Congestion Charge zone from 7:00 and 18:00, Monday to Friday, excluding public holidays and between Christmas Day and New year’ s Day.  (Jonathan Leape,2006)“ The congestion charging zone covers the ‘Central London’ which is defined as the area inside the Inner Ring Road, including the financial center, Parliament and the principal government offices, the major tourist sides and main centers of business, law and entertainment.” (As shown in graph 1). Residence who live in charging zone are entitle to 90%, vehicles with nine or more seats etc. enjoy 100% discount on the charge. Motorbikes, ambulance, vehicles used by physical challenged people etc. are listed in exemption list. The payment ranges from £9 to £12/day depending on paying in advance, or midnight on the day or on following day.  Technologies such as video cameras at every entry point and automatic number plate recognition technology are applied to capture the images of vehicles.  Alternative detection technologies, like “Tag and beacon” system based on microwave detection, systems based on Global Positioning System, and Global System for Mobile Communication are under review to ensure higher recognition accuracy. If drivers are caught by the camera and don’t pay the fees, they would face very harsh penalties: “From May 20, 2013, the penalty charge is £130, and halved if paid within 14 days. If it is not fully paid within 28 days, then the penalty charge will increased to £195.

Impacts

Traffic conditions

      When the congestion fee was imposed in 2003, the number of vehicles dropped between the day before and charge and after charge. (Transport for London,2003a) The average travel speeds on roads increased by 17%, the proportion of private cars in total transport dropped 34%.  (Todd Litman, 2011)  Most people change their travel pattern to public transport. Others shift mode to taxis, motorcycles, pedal cycles or walking.

      How about the traffic condition of London, today? Transport of London claimed that the average traffic speeds in central London would have fallen from 10.6 mph in 2003 to 7.1 mph in 2006 and congestion rose markedly between 2005 and 2006.[1] London was second only to Brussels in terms of Europe’s most congested cities, despite the congestion charge and UK drivers spent 30 hours in traffic in 2013, an hour more than in 2012.[2]

Cost, revenues and revenues distribution

      (Todd Litman, 2011) It is predicted that the costs and revenues of this program between 2000 and 2008 are £500M and £800M. However, charge revenues have been lower and penalty revenues higher than anticipated. Transport in London estimated net annual revenues were expected to range from £230M-£270M. More conservative estimates put expected net revenues in the range of £130M to £150M. Actual net revenues are much lower at estimated £68M in 2003-2004 year and £97M for 2004-2005. In 2012, gross revenue is £226.7M, around 40% are cost.[3] The revenues from congestion charge will be used to improve public transportation service, including renovation to the subway system, increase the numbers of buses and expanded bus lane system.

Criticism

      There is really a lot of criticism about this policy. In 2003, may city enter retailers blame the charge for decreasing sales. The wrongly tickets were common, the accuracy of system was doubted. There was concern about the spill over congestion on nearby roads due to diverted traffic. In addition, it is argued that the double charging is not fair since motorists pay registration and fuel taxes. The burden on low-income commuter and the residents’ exemption are also blamed as unfairness.  What’s more, the pricing efficiency is also criticized: Firstly, the congestion charge is not based on the driven miles. So negative externalities are not fully charged. In that case, the over demand on road using is partially solved. Secondly, the charge is time constant. Ideally, more money should be charged during peak hours and less in non-peak hours. Last but not the least, the charge could be location-variable. It would be more efficient to charge higher rate on more congested roads. The flat was fast and easy to implement but it does not incentivize drivers to minimize driving.

Conclusion

      Although, this projects face a lot of pressure in politics and economics, but it has been implemented for more than ten years. This project is an important and valuable test of the political feasibility in major cities. (Todd Litman, 2011) London’s experience show that congestion pricing is technically feasible and effective, and it is possible to overcome the political and institutional resistance.

      In terms of severer congestion problem, some people conclude “unfortunately it make any difference”. Honestly, I am pessimistic about the sustainability of this policy if the trend of congestion goes severely. Definitely, the better pricing systems are needed. But the improvement of the current system are in great need of investment. So policy marker should consider to attain new source of revenue and to distribute the revenue more broadly to gain wider support.

      In this project, there are winners and losers, it is impossible to judge the project by aggregating those “yes” and “no”. Clearly, it is not “making no difference”, Most importantly, it is definitely reasonable to pay for the road we use, the waste we emit. As a human, we have to recognize the responsibility that we have not considered before.  The congestion fee is not a panacea, but deserves to take.

Reference:

  1. http://www.independent.co.uk/news/uk/home-news/the-big-question-has-the-congestion-charge-been-effective-in-reducing-londons-traffic-781505.html
  2. http://www.bbc.com/news/uk-england-london-25622364
  3. http://www.bbc.com/news/uk-england-london-21451245
  4. http://www.tfl.gov.uk/modes/driving/congestion-charge
  5. http://roadpricing.blogspot.ca/2013/02/10-years-of-londons-congestion-charge.html
  6. Jonathan Leape, 2006. The London Congestion Charge, Journal of economic perspectives, volume 20, number 4. Page 157-176
  7. Todd Litman, 2011. London Congestion Pricing, Victoria Transport Policy Institute.

[1] http://www.independent.co.uk/news/uk/home-news/the-big-question-has-the-congestion-charge-been-effective-in-reducing-londons-traffic-781505.html

[2] http://www.bbc.com/news/uk-england-london-25622364

[3] http://roadpricing.blogspot.ca/2013/02/10-years-of-londons-congestion-charge.html

Fish catch policy in Japan

Fish in Japan is a rather particular nature. Fish is an essential part of Japanese daily life. A strong demand for fish is particularly pronounced in Japan. The fish in national diet is a good example, (Carl-Christian Schmidt, 2003) Per capita supplies of fish and fish product in Japan is estimated at 70.6 kg per year compared to a world average of 15.0 kg. Correspondingly, Japan has really huge fish catch for supporting domestic consumption. Japan harvested a total of 6.25 million tons of fish to a total value around 11 billion USD, which made Japan the second largest producer in the world. Interestingly, Japan’s fisheries production doesn’t continuingly increase with the (FAO) growing human consumption. In 2009, Japan’s fisheries production volume was 5.43 million tons, which is about half the peak volume in 1984. Not only Japan, but every fish production and consumption countries in the world face the dilemma: How to ensure both the sustainability of fish resources and stability of fish supply? Probably, I can’t give the answer in this blog. But it is quite worthy of studying the fish catch policy in Japan which is well-known for its coastal community based fisheries management and its approachs to sustain fish resource.

Fish catching management methods in Japan

In the White Paper of fishing in Japan, it states three resource management methods to protect fish from overexploiting in Japan: input control, technical control and output control.

The input control is the fishery permission system which controls the quality and quantity of fisheries operation, i.e. restrict the number of vessels, the engine power of vessels and operating periods, etc. The technical control regulates the ways of operation, such as, the maximum net mesh size, the banning on spawning period and establishment of protective zones. In the language of what we learnt in 525, these two methods could be understood as controlling of “effort”. The fishery permission system and operation regulations raised the cost of efforts of fishing, so that curb the excessive inputs of overfishing. However, as fishing is open access resource, it will definitely be profitable in the terms of no COGS (Cost of goods sold) but expenses (“effort”), fish catchers have enough incentives to pursue profit as they only pay for expense. Even, under technical control, the technical development in fishing would offset the effectiveness of policy. Hereby, output control is quite important and Japan executes Total allowable catch (TAC).

The TAC system directly manages the catch of specified species with the upper limit of total catch in tonnage. Currently, TAC apply to eight species. Research ship surveys of the seas are conducted every year to assess the status of fish stocks. Fisheries Research Agency makes recommendations on the total catch amount based on the stock assessment and socio-economic conditions of the fishery type. This method is actually the disaggregated quota that we learnt. It helps to retain the fish resource and solve dumping problem under high effort cost. Specifically, with disaggregated quota, the revenue maximizing legal landing equals to the quota for each type of fish. Given the technology level, if the price of effort is low enough, fisher will discard the cheap fish and retain expensive fish. If the price of effort rises, ideally no dumping occurs. If the price of effort increases further, then the quotas no longer bind. In the case of Japan, although the TAC is quite information intensive, I believe the TAC system works well in terms of retaining fish resources and solve dumping problem. Because the input control raises the cost of effort to a really high level. Besides, (Mitsutaku Makino, 2011) Fishes and their organizations play a core role in the Japanese fisheries management regime, in both resource and ecosystem conservation. So, Japanese fisherman has a high self-awareness of sustainable fishing.

Mitsutaku Makino exposed an interesting data (shown in below table) in his book “fisheries management in Japan”: the real amount of catch in Japan is far below the TAC. I am really interested in the reason of the gap, however, they are not demonstrated in the book. Is it because of the overestimated TAC, effectiveness of input and output control or the economic inefficiency of fishing sector??

Resource: Mitsutaku Makino, fisheries management in Japan: its institutional features and case studies. 2011

Hot repute on fisheries reform

In 2007, a policy report published by an influential think tank suggested dozens of specific policy measures to be implemented by the Japan national government. Several measures have sparked heated debate within the fisheries industry, academics and the government. One point is to introduction of Individual Transferable Quota system to abolish entry barriers to fisheries and made it open to anyone. Actually, Japanese fishers have autonomously introduced IQ, but not explicitly defined ITQS. But the small-scale fishers and processors, spoke out strongly against the report, especially the coastal fisheries open and adoption of ITQ.

The ITQ is similar with the cap-and-trade in carbon emission reduction policy. It is the freely transferable of TAC. The participants can sell the rest part of their unused quota to others. The gap in above tables maybe because of lack of the ITQ, i.e. fishers can transfer the abundant quota. If the quota is fully used, it could be contribute to increase the supply for satisfying the fish production consumption in economic and sustainable way.

However, the small-scale fishers and processors who strongly against claims that decline in the economic efficiency of the fisheries must be addressed, but not through the unrestricted entry of large companies from outside local communities. The adoption of ITQ would destroy these historically established verified systems, and would change the fisheries sector into short-sighted profit-pursuing industry.

Conclusion

We could see that the effectiveness of fish resource management methods in Japan deserves to be highlighted in terms of overcome overexploiting and dumping problem. We always concern about the overexploiting of fish, however, this is not the case for Japan. Its biggest problem is gradually less competitive with other countries in fish catching and the economic inefficiency in fish sector. The fish reforms may aim to solve this problem, but we couldn’t deny that there are profit pursuing incentives. To balance the increasing demand and sustainable supply is always hard. Especially, the fishing policy is not the simply economic problem, but intertwine with political concerns. In Japan, if the “economic efficient” policy shakes its community based fisheries interest, we could understand why fishers say “No”.


Reference:

  1. Mitsutaku Makino (2011): Fisheries management in Japan: its institutional feature and case studies. Springer
  2. Matthew A. Turner (1996): Quota-induced discarding in heterogeneous fisheries. Journal of environmental economics and management.
  3. OECD: Fisheries of Japan: fisheries policy outline for FY2011. White paper on fisheries
  4. Carl-Christian Schmidt (2000): Fisheries and Japan: a case of multiple roles?

Carbon tax in Finland

Carbon taxes have existed for nearly 20 years in the wold. It is firstly emerged in Finland in 1990s. The tax rate is $30 per metric ton CO2. Originally, the carbon tax is based only on carbon content, it subsequently evolved to a combination carbon/energy tax. Direct statistical data about carbon tax is currently unavailable in Finland. According to Statistics Finland, tax types are listed as energy taxes, transport taxes, emissions taxes and resource taxes. In 2011, total environmental taxes levied are 58.353 EUR billion. 2/3 of total sum of environmental taxes are energy taxes on electricity and fuels. Nearly 1/3 are various transport taxes levied from vehicles. The 2% emission taxes are mostly waste taxes.  [1]From industry aspect, the energy taxes are mainly from household, land and pipeline transport and oil refining industry.


Motivation and Goals

From the common sense, the purpose of the carbon tax is to curb the emissions of GHG, the massive stock of GHG results global warming and initiates extreme weather events. Well, except for the noble goal, the other is initial purpose is revenue collection for government. The Ambassador of Finland Anne Lammila said the motivation for Finland to create a carbon tax is ‘to get more money for the government because Finland economy collapsed for the reason of collapse of the Soviet Union at the beginning of nineties. On the other hand, the oil crisis makes deeper understanding of policy motivated by environmental aspects.’[2]

As a member of EU member states, Finland committed under the Kyoto Protocol to bring annual GHG emission down to their 1990 level in 2008-2012 period. From period 2013-2020, Finland supports EU’s commitment which pledged an EU wide quantified emissions reduction to bring emissions to 20% below 1990 level. [3]The energy strategy and climate strategy of Finland intertwines. Its revised long-term Climate and Energy Strategy in 2008 defines the principal objectives and means of Finland’s climate and energy policy for the next few decades, within the contest of the EU. In 2009, Finnish government adopted the Foresight Report on Long-term climate and energy policy to supplement the longer-term ambitions of the 2008 strategy. The report outlined possible paths to low-carbon Finland by 2050. It sets a target for Finland to reduce its GHG emission by at least 80% from 1990 level by 2050. [3]

Carbon tax/energy tax and EU-ETS

The IEA report claims that the increase in Finland’s emissions by 2050 is almost entirely due to emissions from sectors covered by the EU-ETS sector. The EU-ETS is a mandatory cap-and-trade system established for limiting emissions from energy and emission-intensive sectors. The missions trading sectors includes coal, peat-fired power plants, district heating, oil refineries and energy-intensive industry sectors. Their emissions accounted for 52.4% of total national GHG emission in 2011.  The 47.6% Sectors or activities not covered by the scheme should be dealt with energy or carbon tax.[4] Industry like transport, buildings and agriculture, small industry and waste are subjected to rising tax supplemented by a range of other polices.

Carbon tax implementation

The carbon tax of Finland experienced a series of adjustments and explorations. A technical report of National Renewable Energy Laboratory of the U.S. Department of Energy office in 2009 [5] notes that at the beginning of launch, Finland’s carbon tax is separate component of tax levied on fossil fuels for transportation or heating, it applies to gasoline, diesel, light fuel and heavy fuel oil, jet fuel, aviation gasoline, coal and natural gas.  Commercial vessels and commercial air traffic as well as fuels used for electricity are exempt. The rate per kWh for electricity does not vary according to carbon content, however, a refund is applicable for renewable electricity. We are also informed that Finland’s carbon tax was initially based on carbon content, it was modified to include a 3/5 carbon component and 2/5 energy component. The energy tax was based on energy use in Mega Watt hour rather than on carbon content of fuel. Starting from 1997, Finland returned to a pure carbon tax. The carbon tax was most recently increased to €20 per metric ton CO2 on January 1, 2008.

The International Energy Agency mentioned tax reform of Finland in its 2013 review of energy policies of IEA countries[3]. In 2011, the government changed the structure of energy taxes on fuel for transport and heat and power plants. The taxation includes the energy content, CO2 emissions and particle emissions that have adverse health effects.  In 2011, an additional EUR 730 million was collected in taxes on fuel for heat and power plants, and energy taxes on electricity. In addition, tax on natural gas is to be increased. Peat is now subject to a tax. The weight of levies on carbon dioxide has been raised from their 2010 level. Biofuels which meet the sustainability criteria will be levied carbon tax, but a flat-rate tax reduction of 50% is applicable. The biomass originated from waste and residues, non-food cellulosic and lignocellulosic materials is completed exempted from the CO2 tax. The CO2 tax does not apply to wood and other biomass used in the production of energy. From the start of 2011, carbon tax for fossil fuels used in combined power and heat production were lowered by 50%.

Distribution

Tax revenues could be used to achieve socially desirable objective. The revenue collected through carbon tax is distributed to compensate government budget accompanied by independent cuts in income taxes. The tax-shifting packages could mitigate the regressive impact of carbon tax or cap-and-trade program (disproportionately affect low-income households). Furthermore, tax-affecting firms and sectors may desire compensation for the loss of profitability and assistance in addressing competitiveness concerns.[6] A concern is that the tax burden may weaken the competitiveness of Finish companies.

Cost effectiveness evaluation

One of the most rudimentary metrics for measuring carbon tax effectiveness is overall reductions in GHG emissions that can be tracked.[5] According to Prime Minister’s Office, Finland (2000), emissions were 7% lower in 1998 than they would have been without a tax. Also, the impacts of programs funded by specific carbon mitigation measures can be quantified to determine program effectiveness. With such program evaluation, governments administering carbon taxes can change the rate or shift funds to program that are more effective at reducing emissions.  [5]


Reference:

Reference:

[1] Statistics Finland. (2013, Sept). Environmental taxes 2011, by industry.

https://www.stat.fi/til/yev/2011/01/yev_2011_01_2013-09-26_tie_001_en.html

[2] YouTube. (2013, Nov). Carbon tax works in Finland

https://www.youtube.com/watch?v=8j5gop745ek

[3] International Energy Agency. (2013). Energy Policies of IEA Countries-Finland-2013 Review

http://www.iea.org/Textbase/npsum/finland2013SUM.pdf

[4] National Treasury, Republic of South Africa. (2013, May).Carbon Tax Policy Paper.

http://rfflibrary.wordpress.com/2013/05/02/carbon-tax-policy-paper-reducing-greenhouse-gas-emissions-and-facilitating-the-transition-to-a-green-economy/

[5] Jenny Sumner, Lori Bird, Hillary Smith. (2009, Dec).Carbon Taxes: A Review of Experience and Policy Design Considerations.

http://www.nrel.gov/docs/fy10osti/47312.pdf

[6] Pew Center, Global Climate Change. (2008, Fall). Tax Policies to Reduce Greenhouse Gas Emissions.

http://www.c2es.org/federal/congressional-policy-brief-series/tax-policies-reduce-greenhouse-gas-emissions

Closed trading week

I planned to continue my technical analysis kit and I know persistence is a virtue. However, nobody is perfect. At the last day of trading game, I forgive myself to be a lazy bird.

At the day of saying goodbye, people will always be sentimental. I could not say I really fall in love with trading game. But the emotion in trading game seems to be like the feeling in love.  (I am really unwilling to compare trading to love, but they resemble to some extend). You may be secretly delighted when your secret admirer ask you whether he/she can join your discussion group or 15% rise of your portfolio value; You may be regretful of being impulsive to bare your heart and buying or shorting positions at not the exact right time; you may be hesitant on whether to break up with xxx ex and which contract (what price) to order… well,  if you have a love-hate relationship with trading and you can’t hold back to see your open position and CME website, then you may fall in love with it…

Why I am interested in trading game?

The trading game is a journey to experience real market turbulence and explore individual’s personal nature. The unpredictability future market drives participants to discover its real philosophy, however, everyone fails. Probably, that is the charming of future market as everyone see one of its face, but no one ever see its panorama. During the journey, you can observe the hiding nature of yourself. Are you more prudent than ever or greedier beyond what you thought yourself to be?

The sense of reality of simulated trading game overwhelms any case study and exercise. Straightforwardly, it test not only what you learn from textbook, but also how you combine all what you learn with your instinct. Besides, the futures market is like a resource bank. You could find tremendous learning materials and resources if you dig it deeply.

What I supposed to do in trading?

Trading is definitely an art.  A great work is a combination of inspiration and exquisite skill. What I can do is to learn every ‘painting’ skill, prepare canvas and painting brushes. Ultimately, waiting for inspiration.

Technical analysis kits are all kinds of colors. If you want to draw a fabulous painting, you should be aware of the combination of colors. And Economic or industry condition is the framework of your work. Good works depend on how you utilize those items.

Lastly, I am really grateful for Mark and my dear classmates. I learned a lot from your patient instructions, fabulous ideas and rich learning experience. 

Technical analysis learning week

Even though, U.S. government shutdown ended with a new budget agreement, monthly reports of USDA for Oct.14 were canceled. Some traders may wait and see until report updates. Then, you miss the chance. This bullish week (especially soybeans and corn) largely depends on speculation that China has boost purchases from U.S. In my perspective, previous expectation on increasing demand from China (because of the flood) seems to be proved. However, I am not sure whether this two events are likely to be directly connected.

What did I do?

I decided to step out of safe zone, heavy positions are taken. I took 20 contracts of corn DEC, 10 contracts of corn MAR and 10 Soyoil DEC on Oct 14.  The main reason for I do these transactions are (1) amortization of cost (2) higher demand expectation

Most of my long position are for diluting my cost. I bought 20 contracts of corn DEC at 4.35 which is below my previous cost 4.41 with 5 contracts. For Soybean oil, It nearly bottomed to starting value, I bet it may rebound in response to expected Chinese demand. And I won about 15000. Below attached my portfolio summary till now.

Why did I turn to technical analysis this week?

I define myself a kind of person who believe macro economy impact and long term observation more. Because I think I am really not that kind of smart guy who can remember so many kinds of lines and play them around with a breeze. Honestly, candlestick methodology is still a mess in my brain. For previous personal experience, candlestick chart is a basic tool traders should grasp. Another anecdote is that I quit leaning investment when I was taking my master degree of China because of being afraid of K-line, red and green numbers and so on. I even scared to talk about my finance background for I have never done any transactions in any financial markets, at that time, I have learnt Finance for seven years. Absolutely, loser!

Back to the theme, however, technical analysis could help you to earn quick money and fit for short-term speculations. So I immersed myself a little into some shallow and simple technique tools. Still step away from K line (candle stick chart)!

Technical kits—part 1

Bollinger bands: it is used to measure the highness or lowness of the price relative to precious trades.it consists of an N-period moving average( familiar?) , an upper(lower) band at K times an N-period standard deviation above (below) the MA. A conventional interpretation is Bollinger bands are indicating an overbought market. An overbought reading occurs when the close is nearer to the top band that the bottom band.

Below graphs depicts bollinger bands of soybean oil DEC 30min, daily ,weekly.In 30 mins short-term graph, soybean oil turned out to be an overbought market. Whereas in daily, the overbought features weakened. Market inverse in weekly graph.


Moving average 3 lines indicators: in evaluating the shorts term, MA(4) plots represents the fast moving average, and MA(9) plot is the slow moving average. For the longer term analysis, MA(9) is the fast moving average and MA(18) is the slow moving average. From short term perspective, corn market is bullish because the fast moving average is above the slow moving average.

From long term view, the market is bearish because the fast moving average is below the slow moving average. So it may be a warning that the bullish situation of corn would turn someday, so be care of heavy position and be prepared to for risk exposure!


To be continued….

China week

This week, I am occupied with assignment and time lag. Everyone is likely to wait until U.S. government re-open. Let me talk something else in the waiting period.

A good news for Chinese commodities futures industry : the set-up of new Shanghai free-trade zone.

It is reported that central government of China plans to allow foreign commodities exchanges to set up delivery warehouses in the mainland’s first free-trade zone in Shanghai and help Hong Kong Exchanges and clearing to expand into commodities trading. In the meantime, Beijing would also “gradually approve foreign firms to participate in commodities futures trading” in the free-trade zone which would be established in the Pudong New Area. This news may attract interested eye sight worldwide to the booming Chinese futures market.

To be honest, futures especially commodity futures are not always mainstream financial product in life of Chinese. Possibly, because of black history, higher risk exposure and lack of certain knowledge. However, it seemed like that Chinese futures market did wonderful performance in world stage silently.  I am surprised to see a research paper which indicated Chinese future market joined the ranks of the world’s most actively traded futures. In year 2011, the three most active agricultural futures in the world by contract volume were Chinese-the ZCE (Zhengzhou Commodity Exchange) cotton and sugar contracts and SHFE (Shanghai Futures Exchange) rubber futures. Out of the top ten agricultural contracts by volume, seven were Chinese.

Black History

China built its first true futures exchange in 1993 and soon boomed. The over fast and early boom buried evil seed for the futures. Fraud and price manipulation prevailed in chaotic environment. After the notorious scandal in the bond futures contract (the “327”event), China Securities Regulatory Commission close down 80% futures brokers of the 1000,with only three exchanges remain. Until 1990’ did the futures market start to grow under reform and rationalizition.

Today

Overview of Chinese futures volume


Chinese futures market experienced up and down during its development. The big country has great potentials, so does the futures market. However, running may not be Chinese style, to walk step by step is more rational choice.

Reference:

Chinese futures markets:coming off a booming decade

new shanghai free-trade zone to lead push in futures

Golden week of China, Black Friday of U.S.A.?

The first week of October is the National Day Holiday of China. Cool and sunny weather across the country, toll-free highways, admission ticket discounts and lower gas prices have combined to make this so-called Golden week the best time for travelling. However, creative netizens rename Golden Week as “golden mess” for the best description of the situation as the Chinglish phrase “People mountain, people sea”.

My second hometown, Soochow, as a well-known tourist city attracts tons of travellers during the “Golden Week”. People can hardly move a step in the famous old scenic spot, Humber Administrators’ Garden. The exquisite and gorgeous classic garden overburdened. This scenario is similar in other sites, like Jiuzhagou Valley which is famous for its snowy mountain, colorful water and marvelous forests got into trouble when its shuttle buses failed to cope with a rush of 40000 tourist.

By the way, I was astonished when scanning a comparison map of highway toll station of China with U.S.A.

Another bomb news should be a partial U.S. government shutdown. I won’t stress the serious impact on economy of U.S. and global economy but a quite interesting news.”Don’t Fret a Government Shutdown (Stocks Won’t)”. It mentioned the fiscal cliff fears from last December as “a bunch of sound and fury signifying nothing”. So will the U.S. government shutdown?

It seems like that things are not always golden or black even they are called so.

Trade at China-week 2

I was really not surprised to find I was still in Pudong District, Shanghai after one-hour’s highway drive. The traffic jam! After 12 hours flight and 3 hours stuck in highway, finally I arrived home. The old story happened again: a good news and a bad news. The good news was my portfolio value increased about 10000 bulks. The bad news was I couldn’t open some English websites, like Bloomberg probably because of the internet censorship in China (Just like we can’t use Facebook, Twitter in China).

My portfolio summary is shown below:

Lesson 1: Do not fear to buy when price slump

When future price slump, irrational traders go panic and reject to buy as they afraid of price falls again. A metaphor is that the stupid donkey stuck into the same hole twice. My story is I bought 5 contracts of corn (C/Z3) at 4.61 on 19th, then its price decreased to 4.49 on 24th when I covered 2 contracts. Two days later, the price hovered around 4.50. I continued to cover another 7 contracts at 4.52. The action I do is to amortize my cost. After covering my position at lower price, my average cost for 14 contracts is 4.54, which is lower that former 4.61. (Picture below).As the deviation of corn price seems to be not active, I sold all contracts at 4.56, earning 1287.5 dollars.

The point is a big slump is always the right time to buy when you hold the future for a much higher price. The judgement of right time may be based on comparison between current price with the lowest price daily, weekly, monthly, or yearly (Best!). I learnt from somewhere (I can’t remember it is the technical analysis of stock course or my father) that the lowest price line could be a support for price.

Lesson 2:  Play with short under clear expectation!

Search “soybean” in Bloomberg commodity news of last two weeks. The tone is DROP! I shorted 1 contract of soybean (ZK/X3) at $13.34 for fun as I saw the second news about soybeans drop. When I saw the 5th news about soybean drop, I cover my position at $13.09 and earning $1262.5. Luckily, the next day “soybean advance….” It seems like the soybean price has a negative correlation relationship with rainfall. So keep an eye on weather report, it can make you be wealthy. Trust me!

Lesson 3: The emerging market countries could be a huge push to price deviation.

The wheat is the star of this week which enabled lots classmates turn the tide. The reason of latest rise maybe speculation on China to boost purchase. But I am not sure about the selling time point. I closed my 6 contracts of wheat position on 27th at 6.83 as the volume is not large enough above 6.8065. So I chose to guarantee my profit.


P.S: I am not sure whether the link could be opened as I save them in my Favorites before I came to China.

A newbie’s sticky notes on future trade-week 1

People who play in financial market must have their own preferred style.  They could be long-term investor, short-term speculator or switching between both. I find two things that trading games attract me: one is possibly making money instantly; another is exploring self-identity and inner potential. (Sorry for not interested in any economic thing!)

For a future trade newbie, the biggest challenge is not lack of information, but information overload.When I opened all kinds of websits loaded with tons of news about economy, finance, commodities, I totally got confused. So lesson 1 for future trade newbie: learn to screen information for you decision. Besides, I should learn to weight those information as a reference of order and time of order.

When I first opened a transaction, the initial thinking is ‘NOT LOSE MONEY’. I did some stupid transactions:

The prices of same futures product in different months go the same direction, as the shape of price curves of same futures in different months (i.e. Corn Dec 13 and Corn Mar 15) is nearly the same. I bought 1 unit DEC corn contract and short some quantity of MAR 14. This might be a good strategy to lock risk and only works when premium gets wider (price of DEC contract goes higher and higher than price of MAR contract).

Same day, “Fed unexpectedly refrains from QE taper, keeps bond buying at $85 billion”.Everything rose. I bet commodity market would rise at least only one day,then quickly covered my short position and kept my long position and add another wheat long position. Luckily, the bet turned out to be right.

Lesson 2:  before applying any strategy, consider the condition it mostly fits for.

Lesson 3: quickly response to any big bomb news. As quickly as possible!!

Wheat futures rose the most in three weeks on signs of increasing demand for exports from U.S. Export sales of wheat jumped 30%. The Fed decision may provide a lift to the commodity cycle.”

Lesson 4: demand and supply are basic principal for price judgement. Policy will affect the marco expectation for a certain period. But how long??

The last but not the least, HAPPY MID-AUTUMN FESTIVAL!  但愿人长久,千里共婵娟