Finding Cost Path Values:
The first step of this project was obtaining data. The main data used in this project was a shapefile of Kelowna’s future land use.
After I obtained the data I created a geodatabase to store all new layers created and projected all layers with NAD 83 in UTM Zone 11N. I joined the two DEM raster layers by using the raster mosaic tool. This created one large DEM that covered the desired region.
I then converted the joined DEM into a vector. Once a vector of the region was created I was able to clip the Central Okanagan road layer to remove unnecessary road networks.
I then used ‘select by attribute’ on the lakes layer. I selected Okanagan Lake and then created a separate vector layer that contained only this lake. Again this was to eliminate data that was not needed.
3 new layers were created using the ‘new feature class’ geodatabase option, each new layer was a point feature. One point feature was used to mark where the new highway would begin. The other two points where used to mark potential bridge locations.
Once all of the base data was set, cost path analysis could be performed.
In order to perform a Cost Path analysis a new field had to be added to the Future Land Use layer labelled Cost. Next friction values had to be assigned to each Land Use type.
After friction values were assigned the Future Land Use layer was then converted to a raster with 25m cells. The raster was created based on the friction values and the layer was labelled LandCost

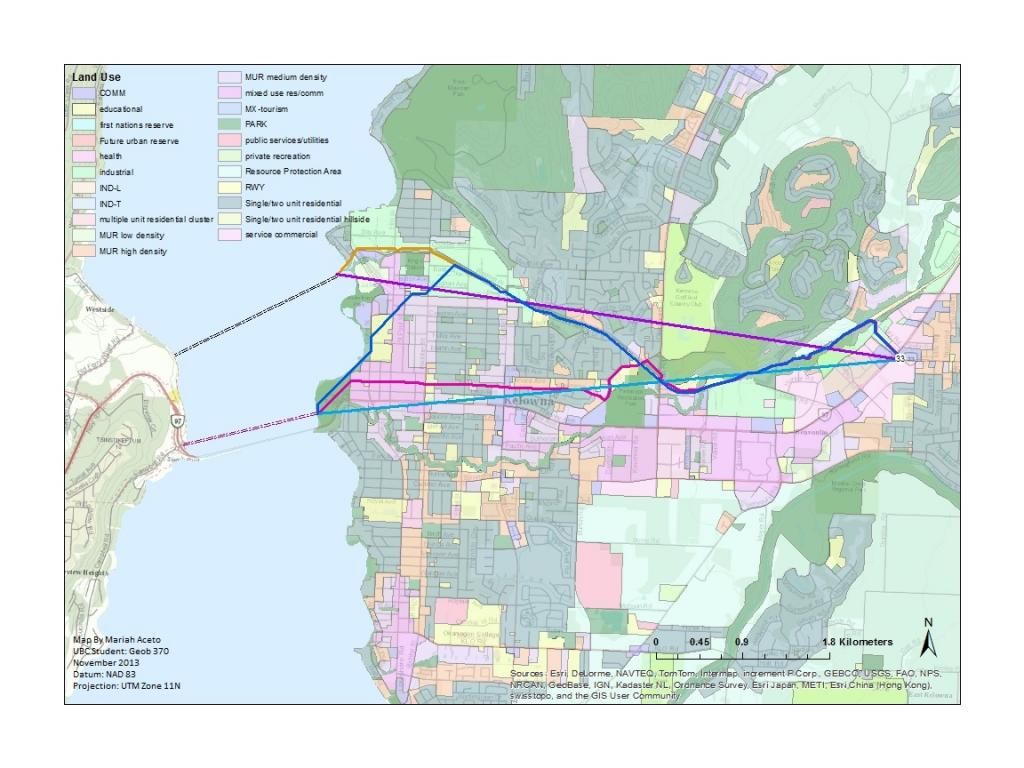
The ‘Cost Distance’ was then used to create a distance raster and a backlink raster. These rasters and the highway end point layers were then used with the ‘Cost Path’ tool to produce a least cost path. The ‘Cost Path’ tool was used twice for a proposed bridge site north of downtown Kelowna and another possible site close to the current bridge. The raster paths created were then converted into polyline layers to create a simplified map.
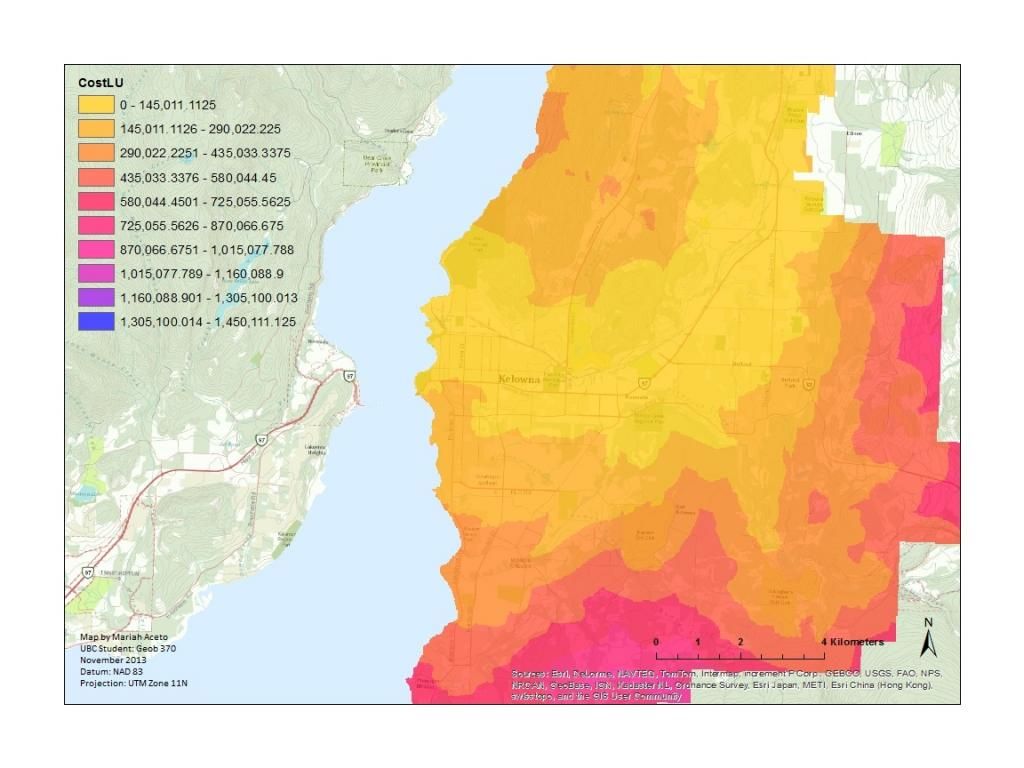 Cost LU/ Distance Raster
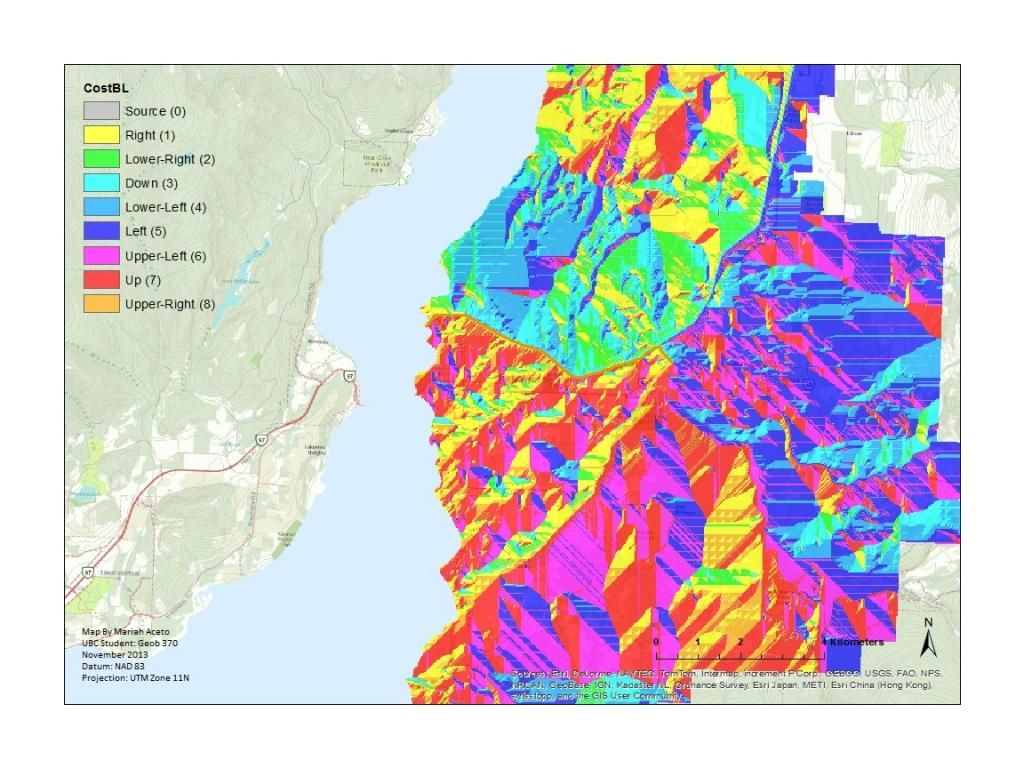 Cost BL/ Backlink Raster
I created another ‘new feature class’ layer next. This was a polyline layer that I used to determine what the friction costs would be if a path were to be constructed along current roads. This path turned out to be the most expensive and should not be considered.
Two more ‘new feature class’ layers to determine the cost of constructing a direct Euclidean path from the start of the highway to each proposed bridge site. To do this the feature new layers where denoted as polyline layers. To create the Euclidean distance layers, I simply used the editor function and drew a straight line from the highway starting point to each bridge site.
After the creation of these vector layers I converted these paths into a raster layer with 25m cells to match the Land Cost raster layer.
The ‘Extract by Mask’ tool was then used. With this tool it was possible to use the raster versions of all Euclidean and Cost Paths as well as the Land Cost layer to determine the absolute friction costs associated with each path. When using the ‘Extract by Mask’ tool the paths act like a cookie cutter and cut out the raster cells the path overlaps to determine which friction values are assigned to each path.
Once this was done for each path, I created a new field in the attribute table for each extracted layer and labelled it SUM. Using field calculator I instructed the SUM field to multiply the friction value by the number of cells assigned to that type within each path. After this was done the statistics function in the attribute table could be used for each path to determine the overall friction cost of each path.
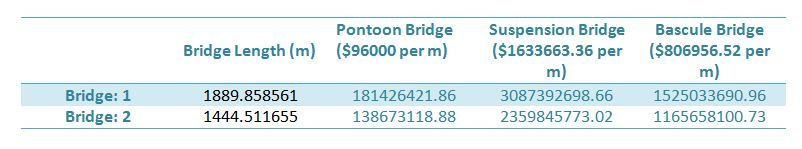
Bridge Construction Costs:
To determine how much it would cost to construct the actual bridge itself, I looked at different types of bridges that have recently been built in BC. I decided to focus on pontoon, suspension and bascule bridges as possible choices. To determine construction costs I simply found the desired bridge type within the province then took the construction cost of the bridge and divided the cost by bridge length. I was then left with the construction cost per meter.
I used the current Kelowna bridge, the WR Bennett Bridge, as reference for a pontoon bridge. The newly constructed Port Mann Bridge served as reference for the suspension type and the construction cost of the future Johnson Street Bridge in Victoria, BC as a reference for a bascule bridge.