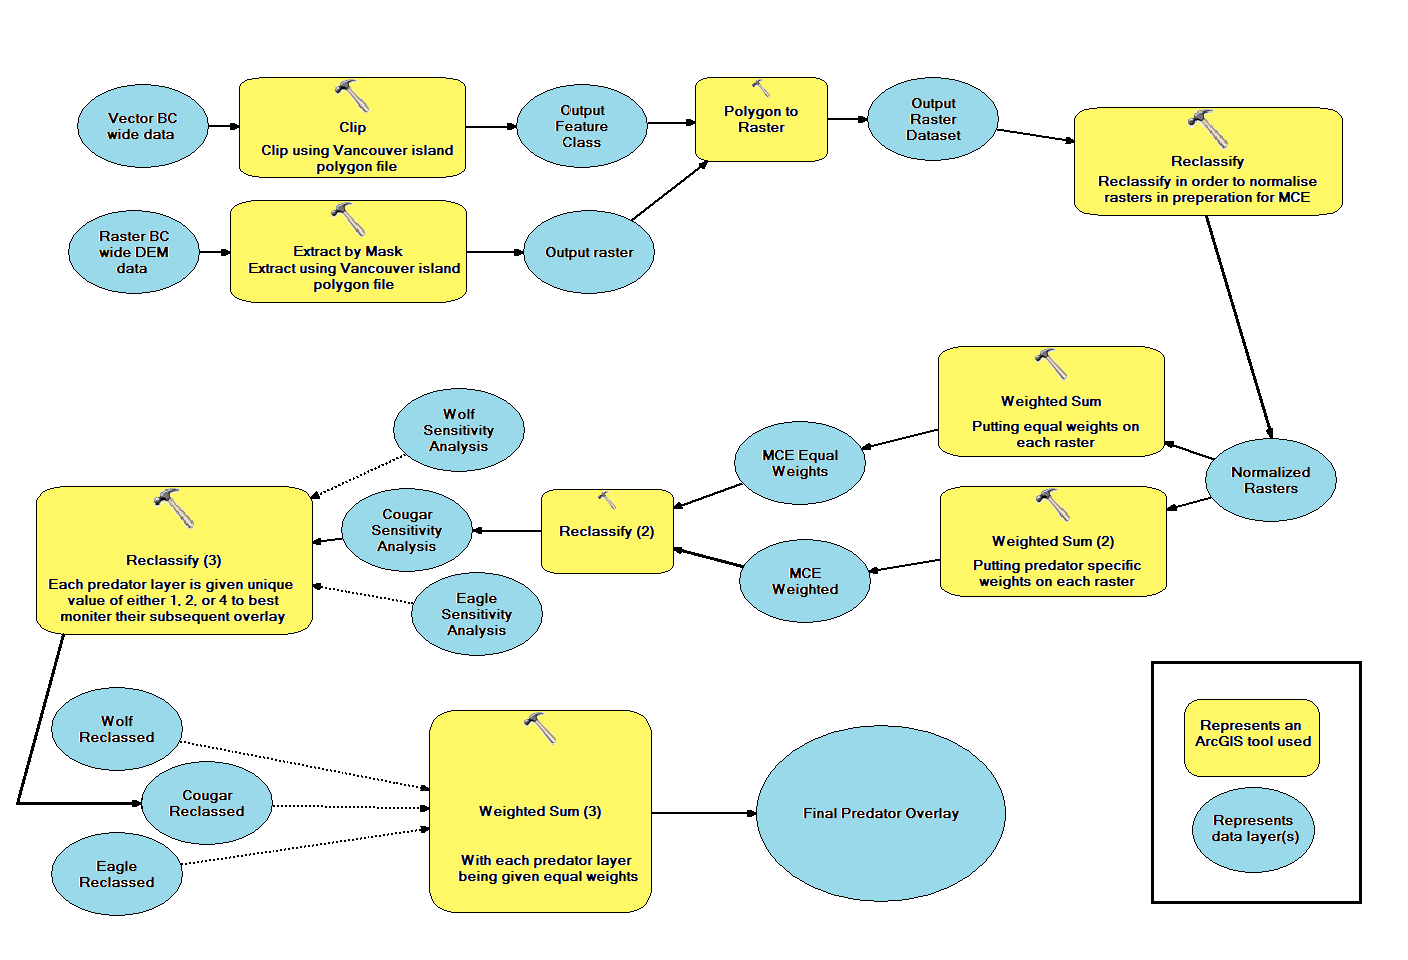
Our analysis involved gathering numerous data from online data bases. Since we are attempting to find out where marmot predators are located we used data that contained specific land features. These include elevation, aspect, slope, water bodies, forest type, highway and roads, as well as population centres. We then clipped those raster and vector data files using a Vancouver Island polygon file in ArcGIS. The resulting vector layers were then converted from polygon to raster. After we created the necessary raster layers we then had to reclassify by normalizing every layer with a classification scheme of 0 to 1; 0 being least suitable and 1 being most suitable. Reclassify and Fuzzy Membership tools were used depending the required classification of the criteria. This was done so the layers would be compatible with each other when performing further analysis.
In order to determine the area on Vancouver Island where the local marmot species is at most risk of predation we decided to conduct a Multi-Criteria Evaluation(MCE) for its three main predators, the cougar, the gray wolf and the golden eagle. The MCE was performed twice per species producing two distinct layers using the Weighted Sum tool in ArcGIS. The first layer generated had equal values attributed to all criteria, labelled Equal Weight Layer. The second layer generated had different proportions given to each criteria based on research collected for each species, labelled Weighted Layer. These individual layers will then display suitable habitat area on the island where it is most likely or unlikely to house predatory species.
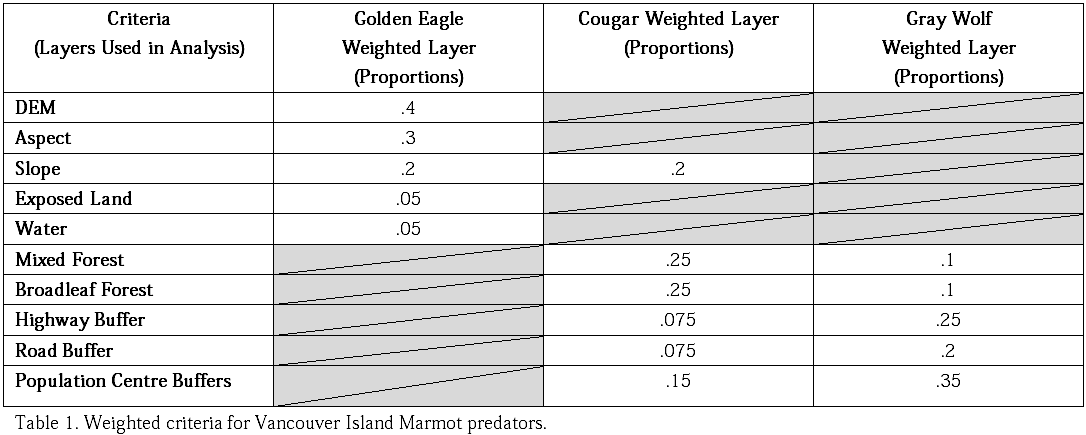
In table 1 we can see the proportion values chosen for each marmot predator. For the Golden Eagles weighted layer we determined that elevation, slope, aspect, exposed land and water were the most important criteria with elevation being weighted the heaviest. Cougars on the other hand prefer a certain slope angle to prowl on so slope was attributed the highest proportion for that weighted layer. Lastly, for the Gray Wolf layer population centres and highways were assigned the first and second highest proportions respectively. Those criteria were chosen as wolves tend to avoid those areas the most.
After the equal and weighted layers were completed for each species they then had to be reclassified in order to carry out a sensitivity analysis. Top 25% of the suitable habitat for each species was considered for this analysis. It brought together both layers into one all encompassing layer with three distinct classes. The first class displays the only the equal weighted area, the second class shows only the weighted area, and the third class reveals where both areas overlap.
Next operation involved combining all three sensitivity layers. Golden eagles were attributed a value of 1, Cougars a value of 2 and Gray Wolves a value of 4. The value of 3 was not chosen for Gray Wolves so as to avoid having a computational problem of the weighted sum tool misinterpreting 3 as a combination of Gray Wolf and 1 and 2 values to be 3. Equal weights were assigned to all sensitivity layers as the three predators have an equal chance of hunting the marmot.
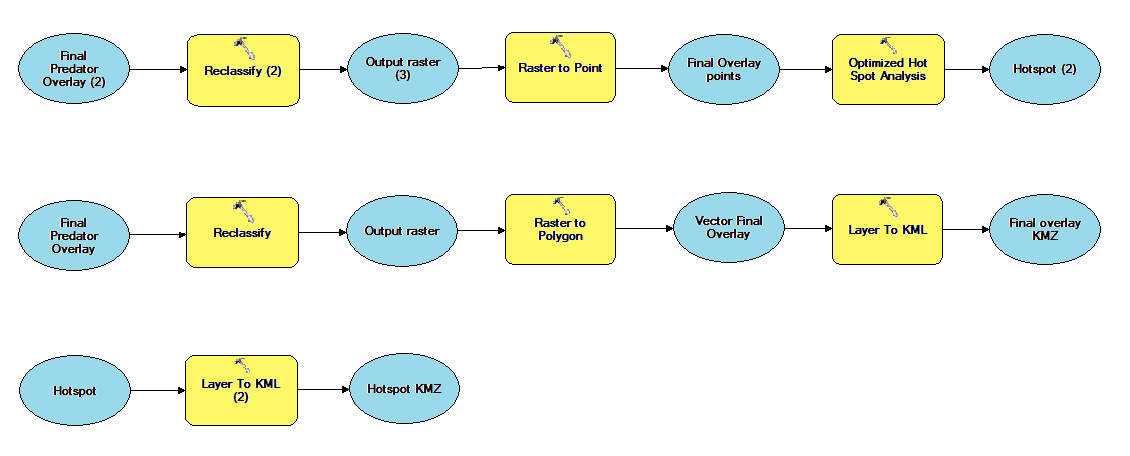
After creating the final predator overlay, a Hot Spot density analysis was carried out. The final overlay layer was reclassified to valid pixels having equal value and then converted to a point vector layer. Optimized Hot Spot Analysis was performed on this layer to create a heat map emphasizing the spatial clusters of predator habitats.
Finally, the final predator overlay layer and the hotspot layer were converted to KMZ files to produce interactive maps to better visually aid the viewers.