Discussion
Results
The multivariate maps I have produced incorporate all the elements of this project into three groups. For single mothers, population below the poverty line, and African-Americans, I positioned the risk-adjusted nearest neighbour ellipses with the GWR results over top of the DK surface. By doing so it becomes easy to identify areas where a concentration of the demographics may be influencing the frequency of foreclosures (red ellipses) that intersect with areas of potentially low and high probability of foreclosure. On my maps I have incorporated areas of interest where these instances occur.
Important note: areas of ‘low probability of foreclosures’ may still have significantly high foreclosure values. Instead this layer should be interpreted as areas where a demographic seems to have influenced foreclosures normalized by the actual demographic makeup of that area. For instance, red areas signify where there are low levels of single mothers, but those single mothers seem to be influencing the frequency of foreclosure.
See these maps below.
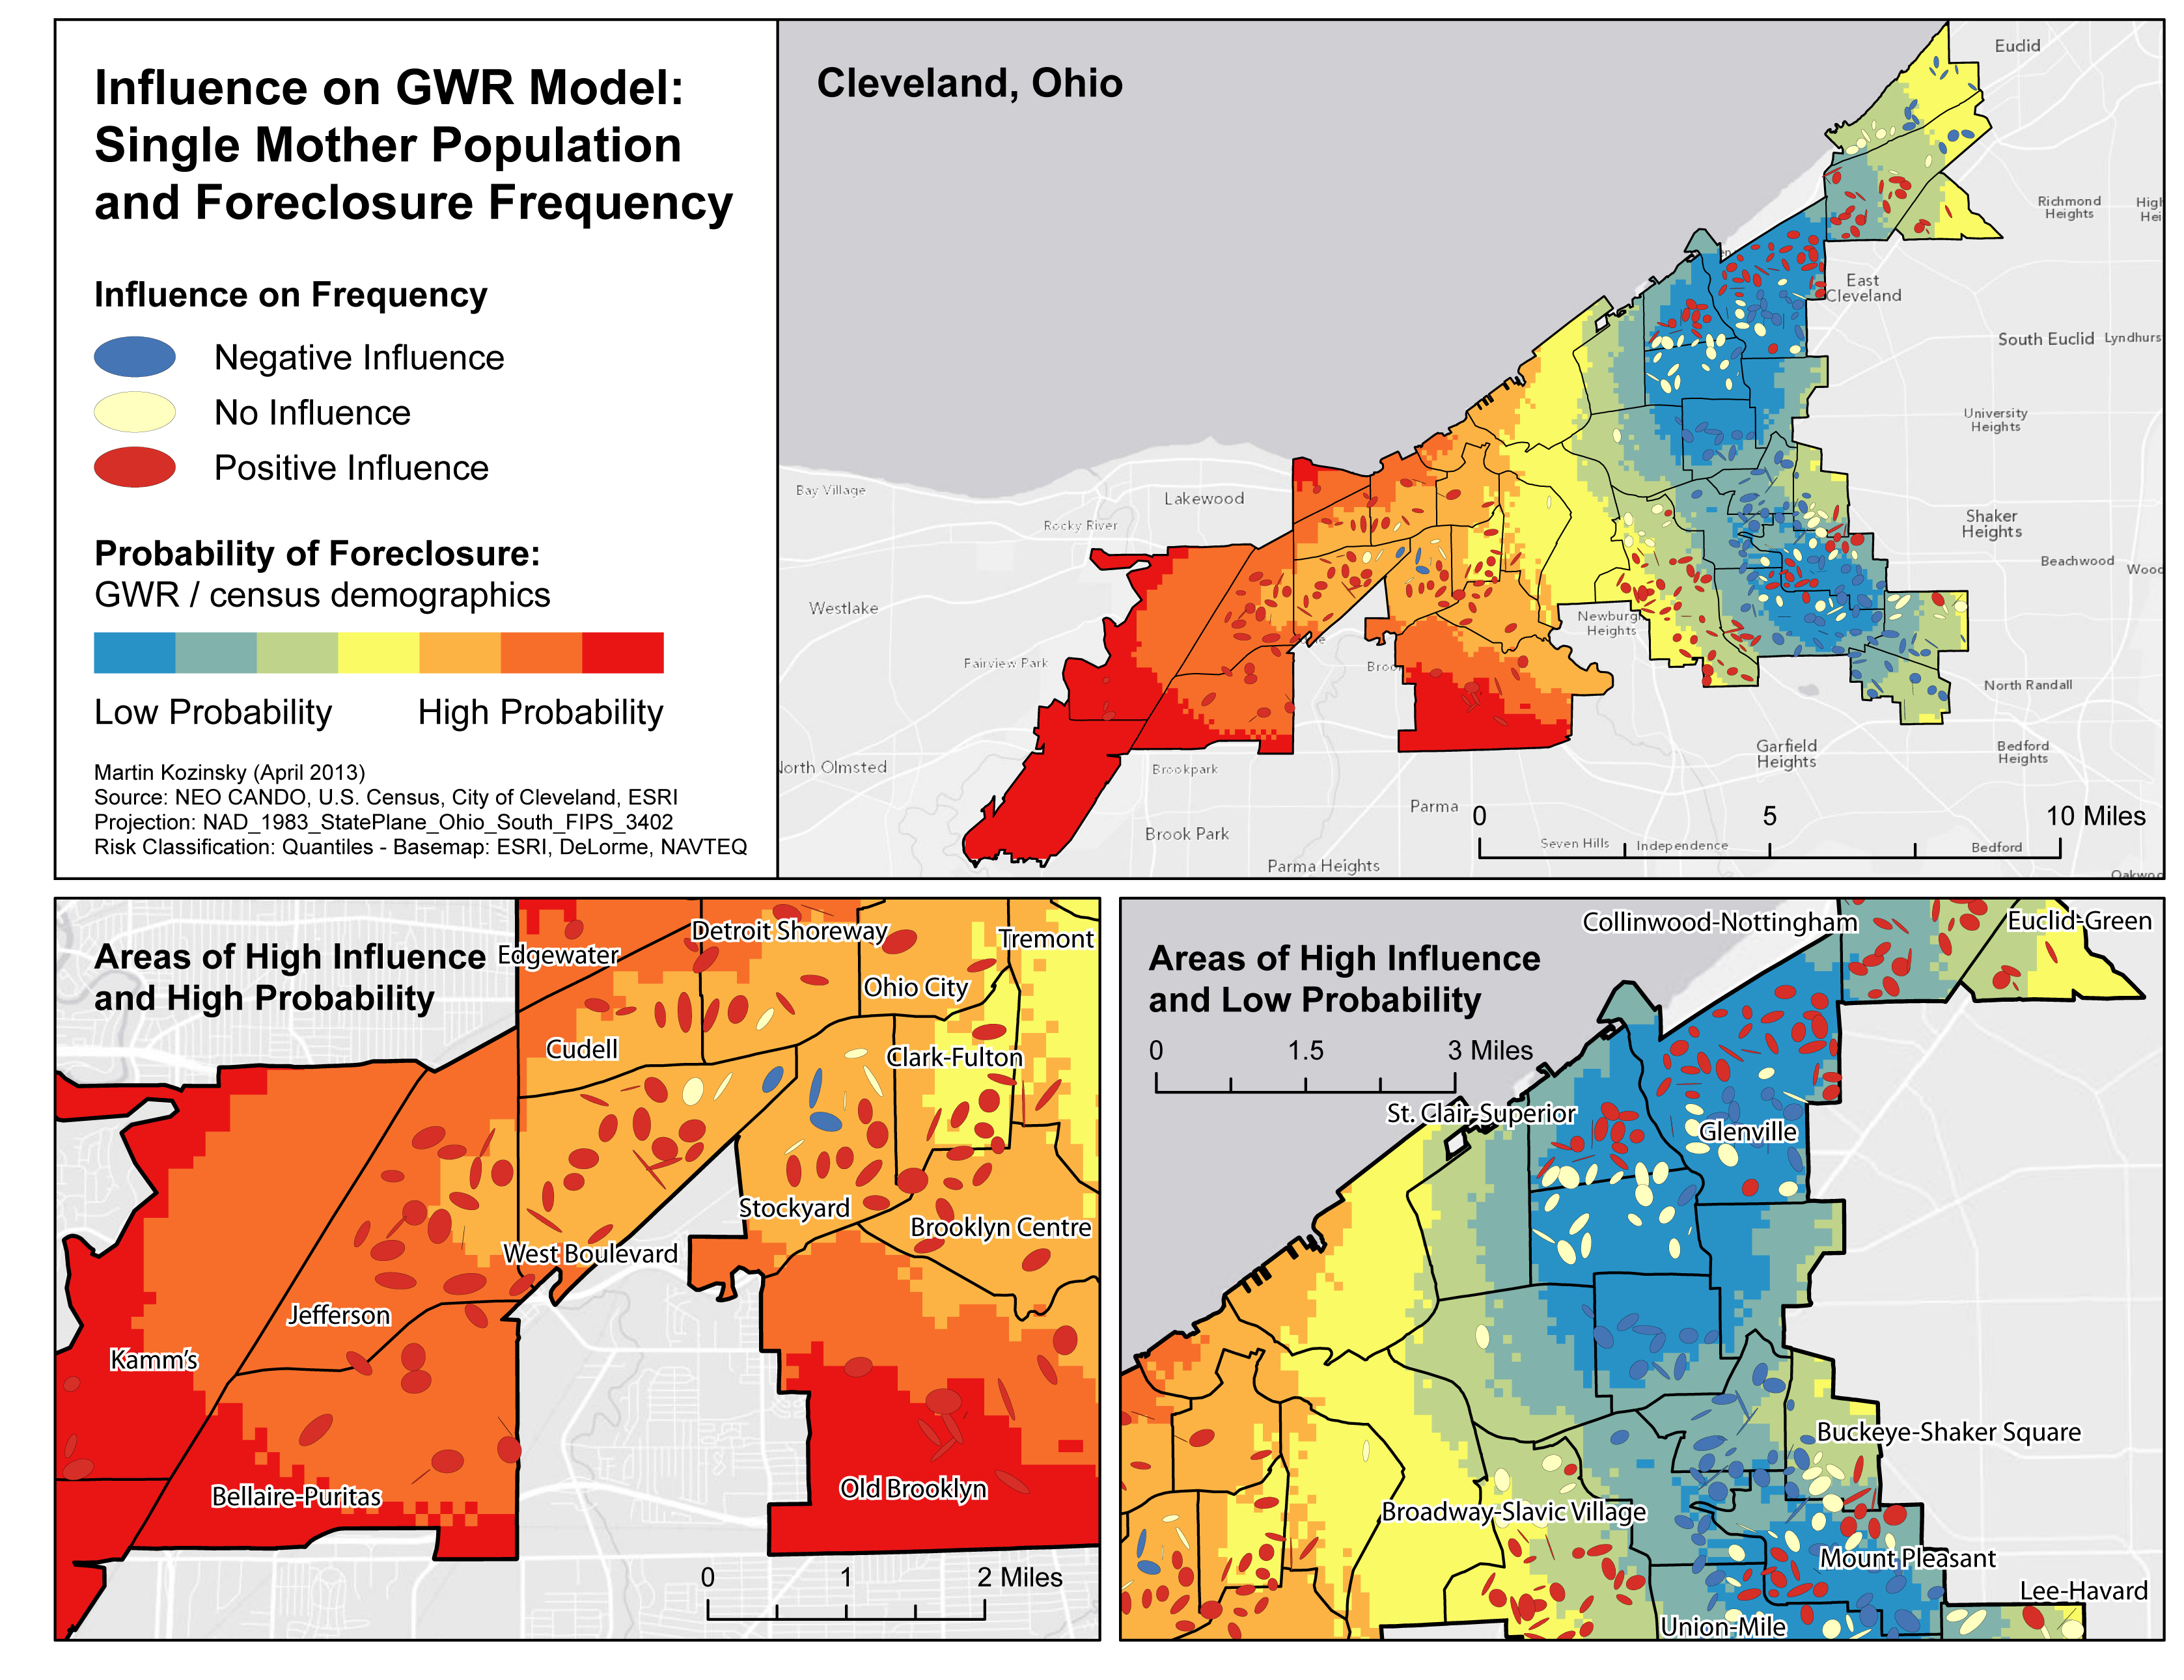
Results for Single Mothers
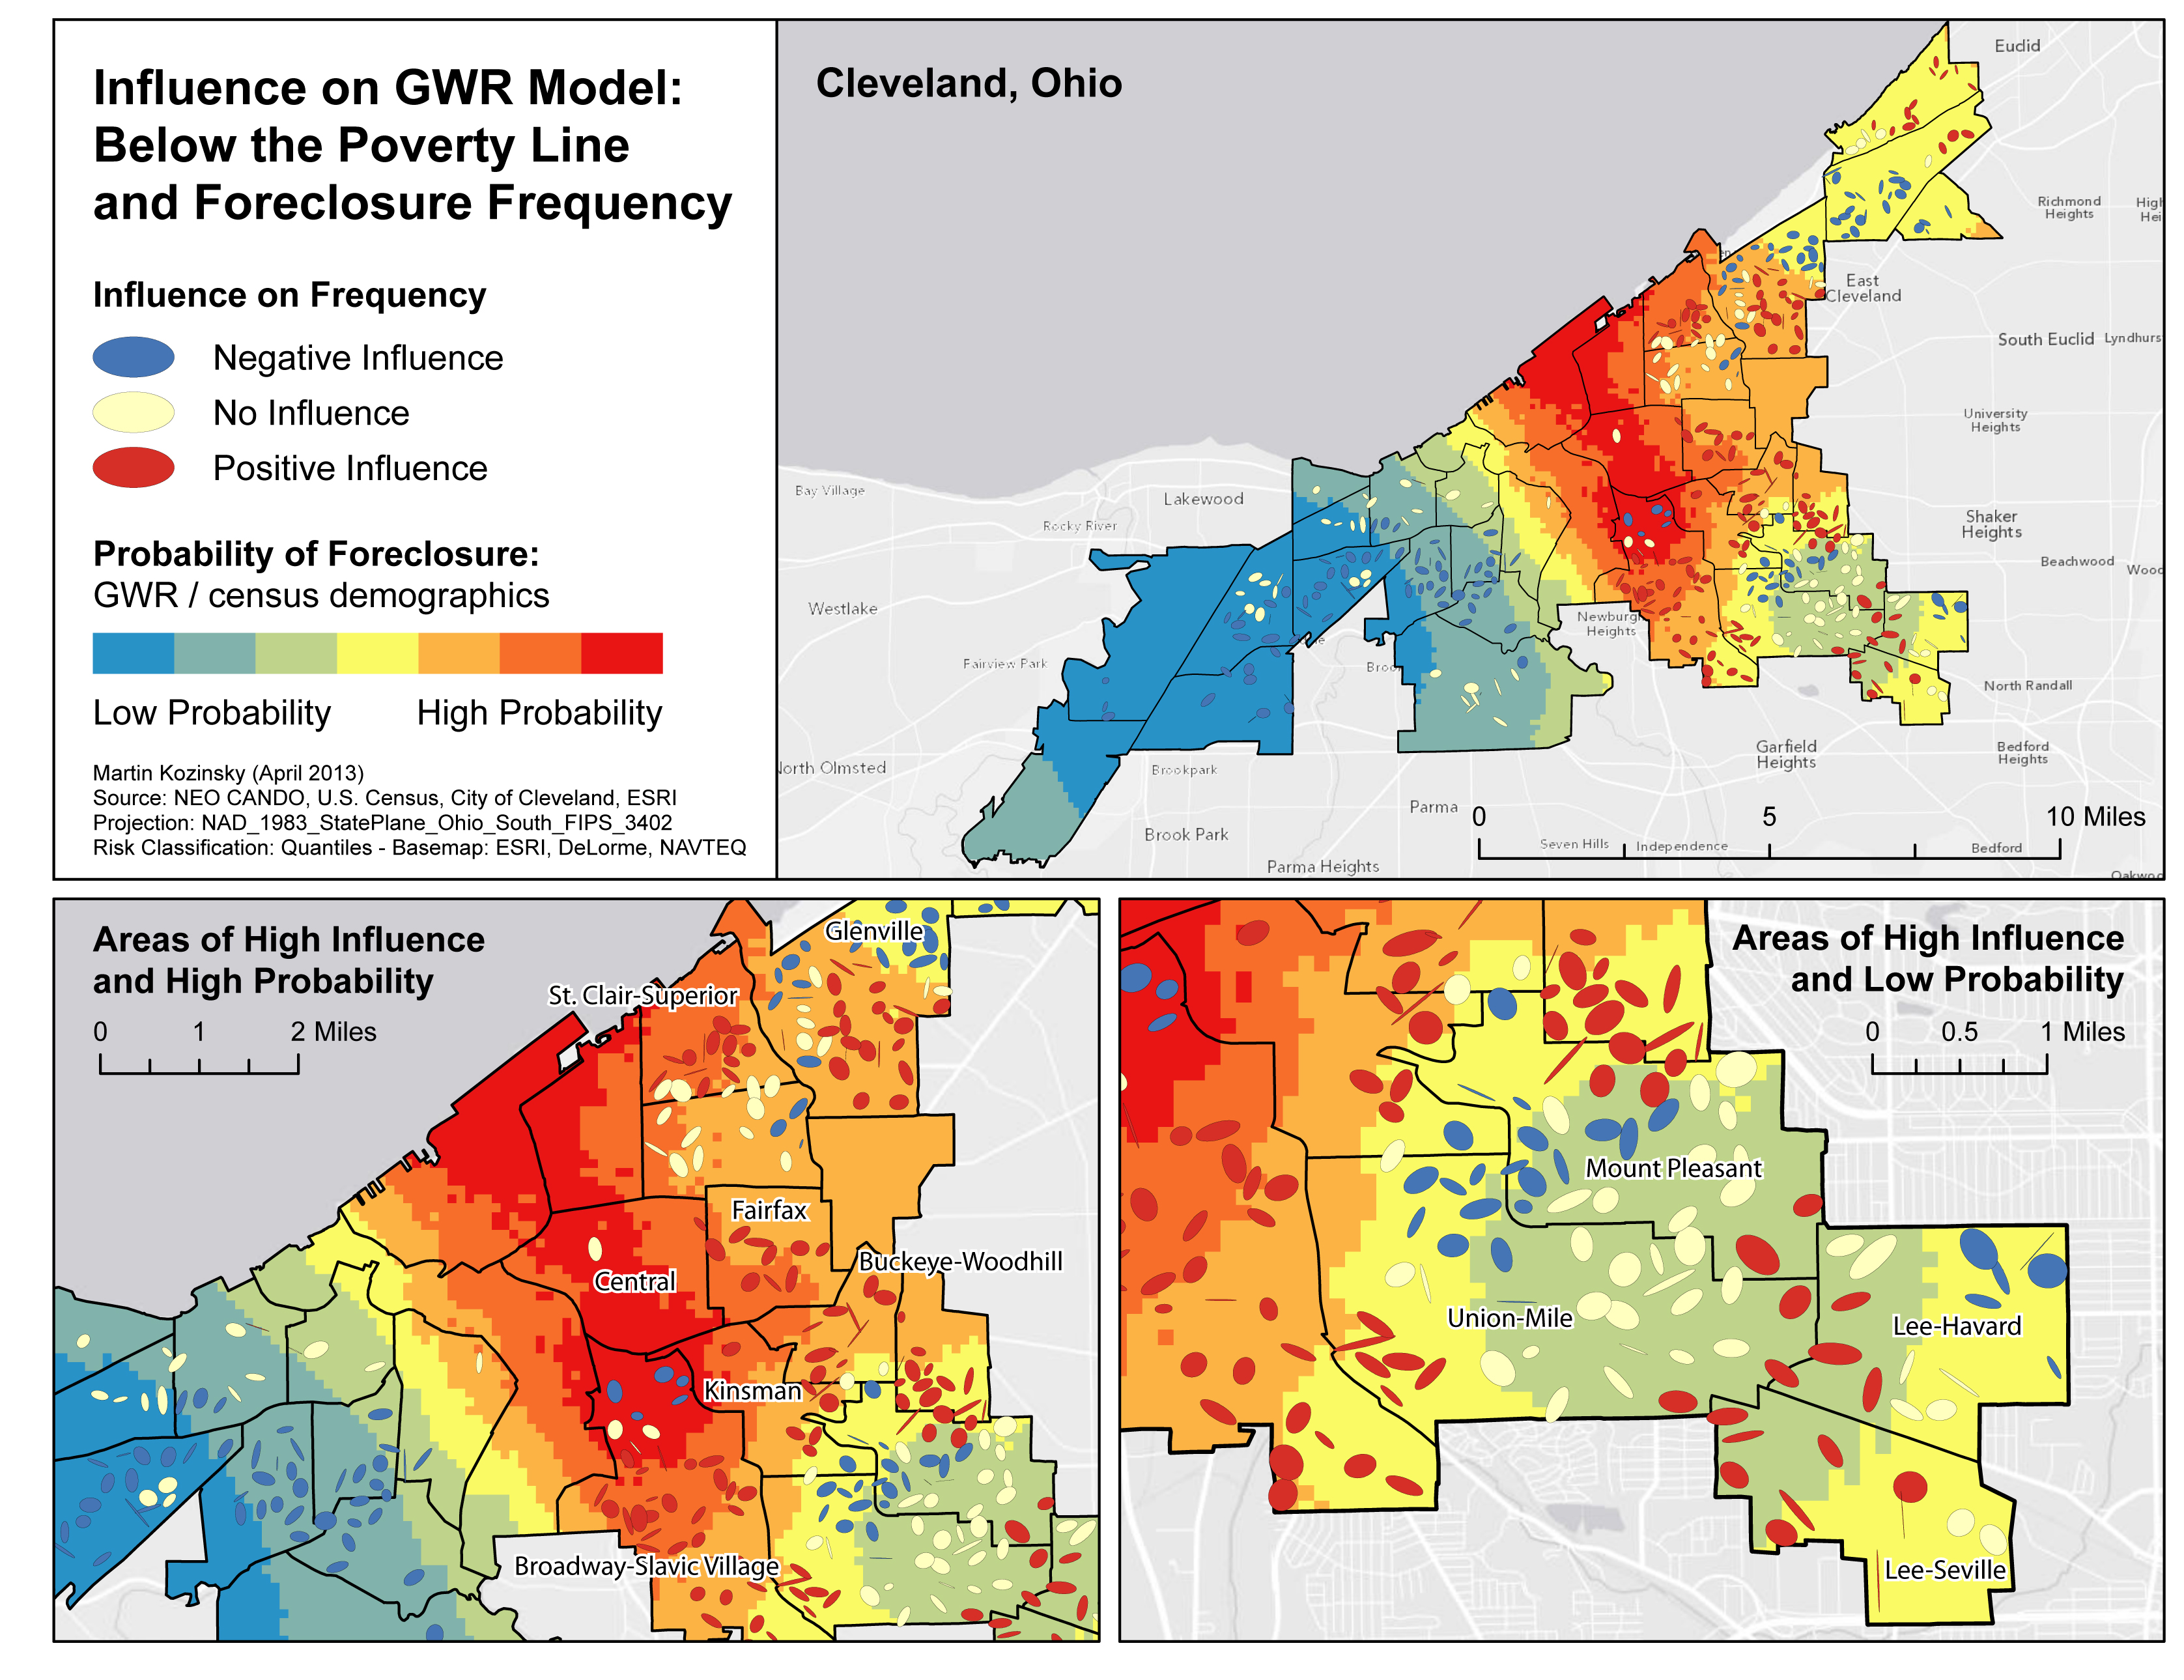
Results for Percent Below the Poverty Line
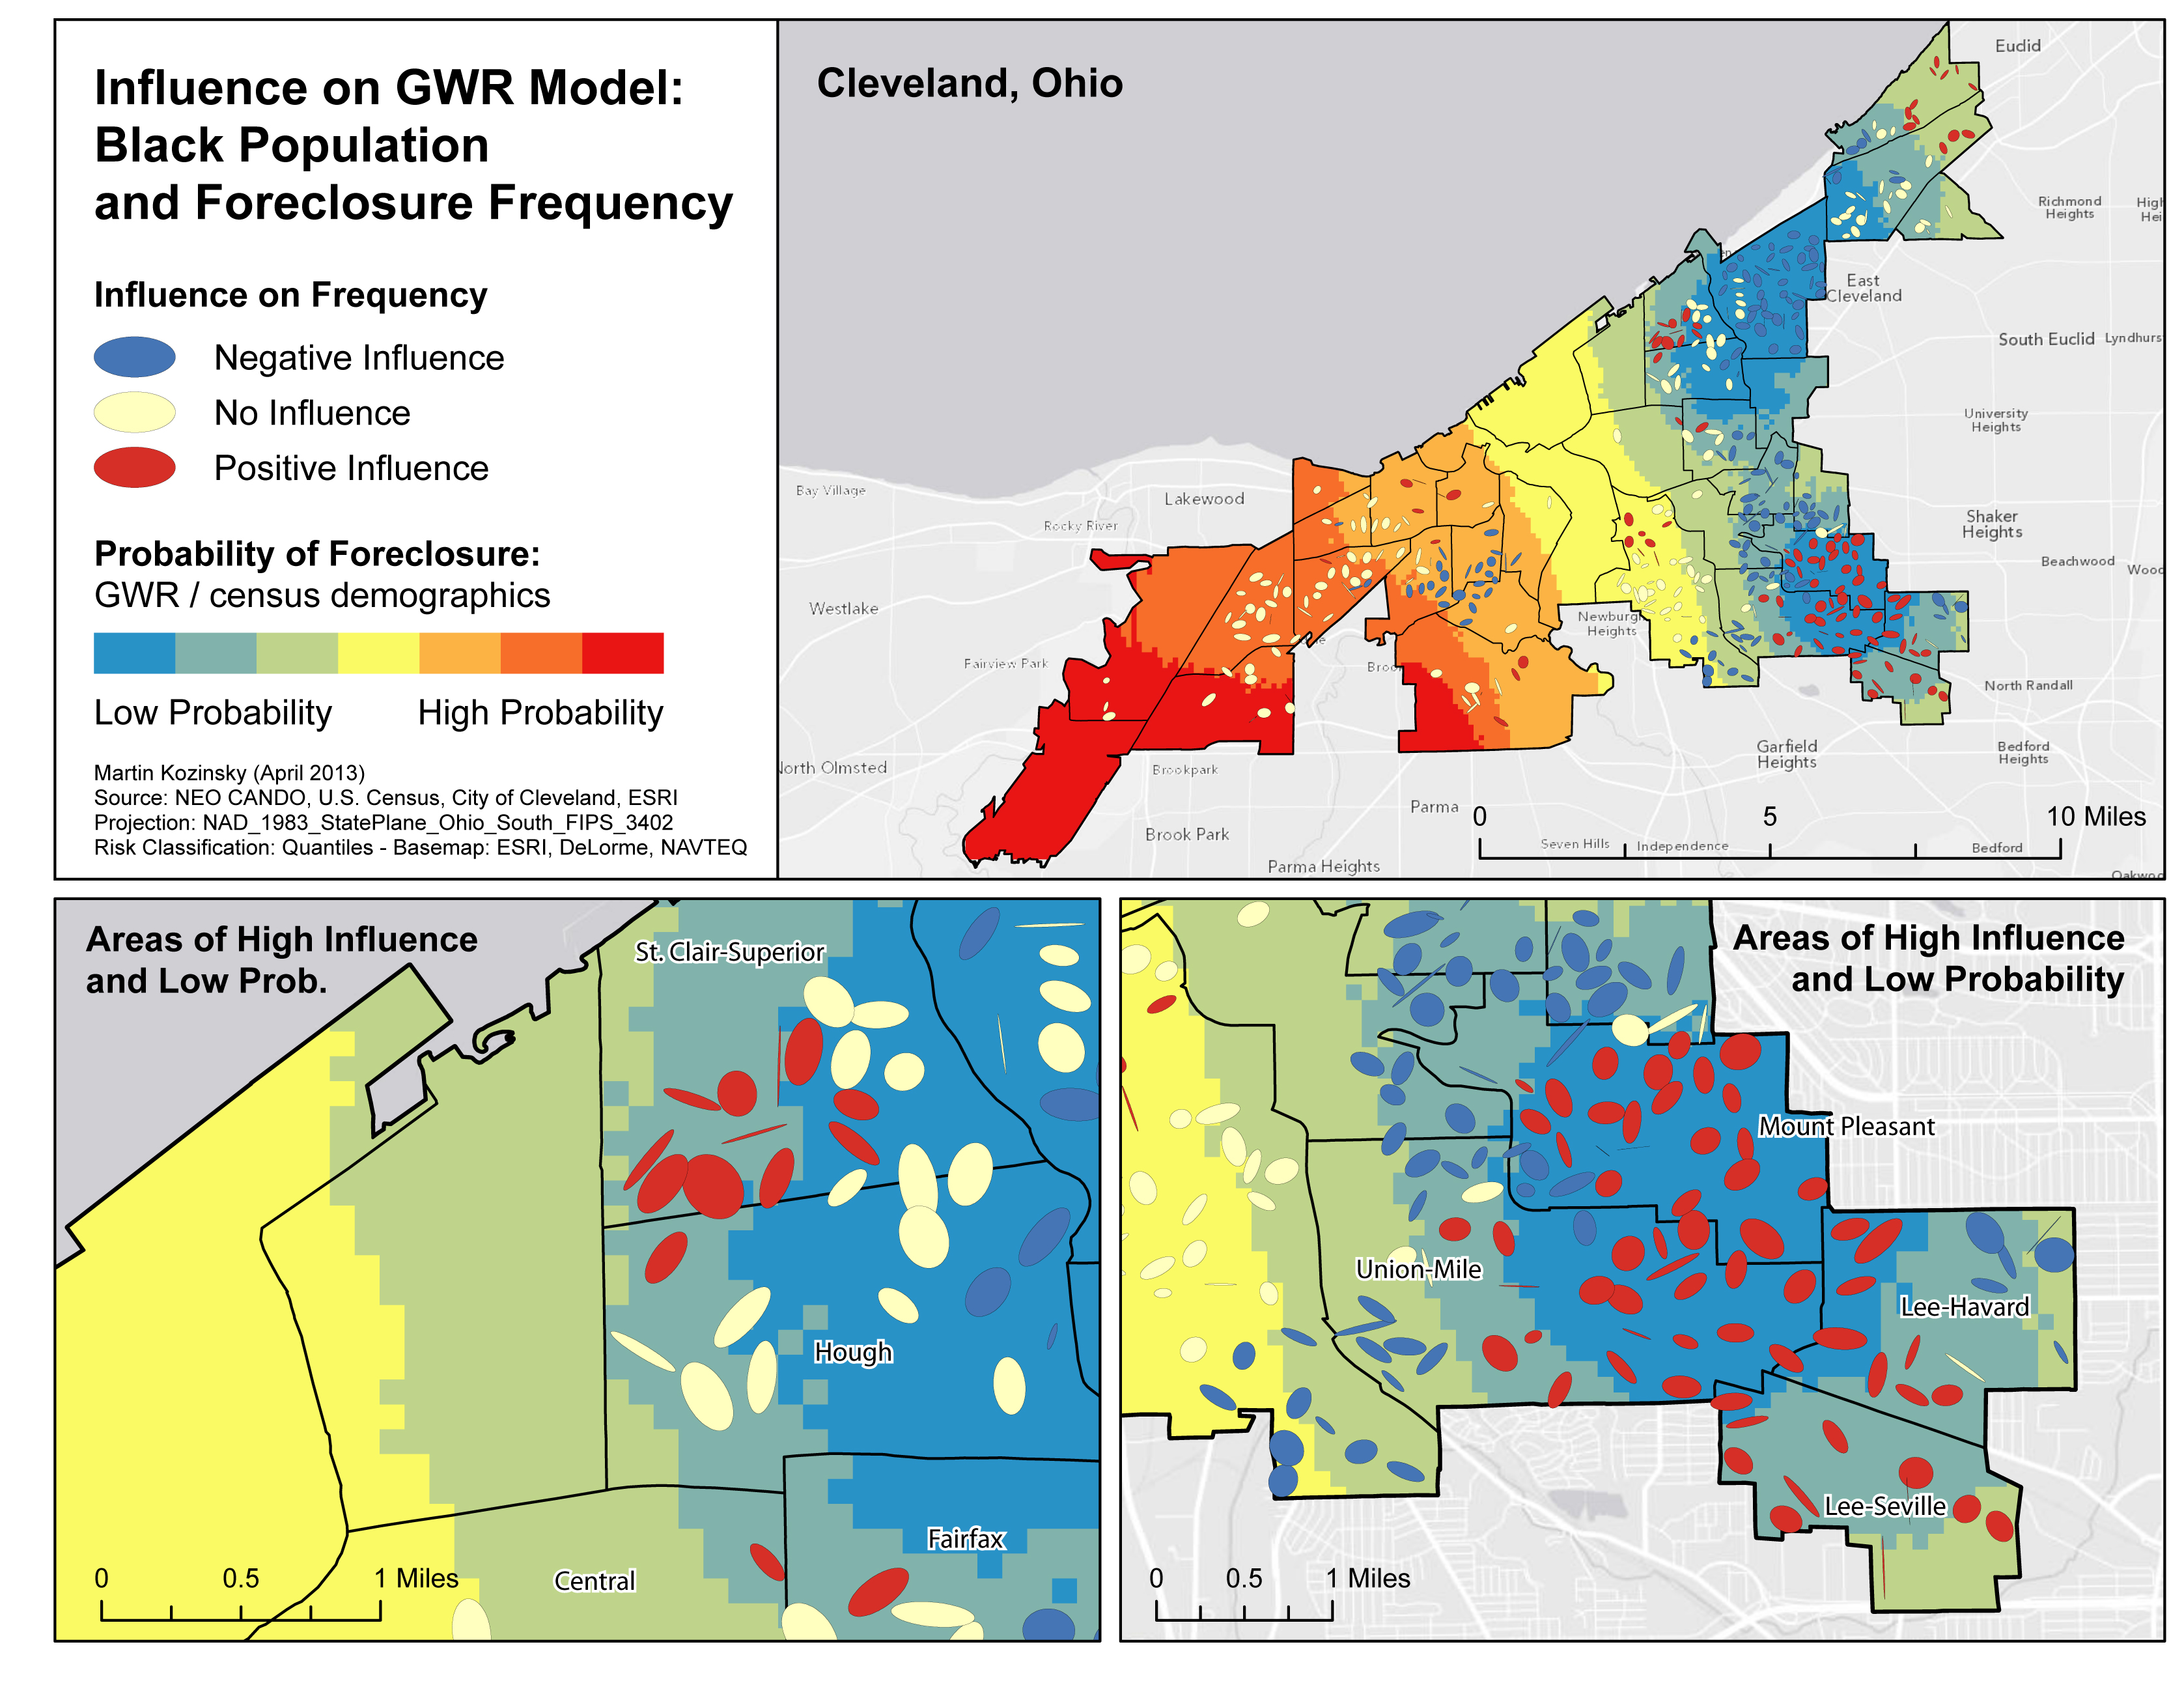
Results for percent African-American
Discussion
Throughout my analysis and by creating the above maps, I can make three general conclusions:
- The groups examined that are most at risk appear to be single mothers, those below the poverty line, and African-Americans.
- There is considerable spatial variation in high probability of foreclosure areas for single mothers and individuals below the poverty line.
- There is also considerable spatial variation in low probability of foreclosure areas for all demographic indicators. There appears to be some overlap in the south-east where all indicators have lower probabilities of foreclosure. Of note is that there seems to only be areas of low probability of foreclosure for the African-American demographic. This may suggest that African-American influence over foreclosure frequency only occurs in areas of high African-American concentrations.
Uncertainty
As with more GIS research there are usually varying levels of uncertainty. While I have tried to minimize uncertainty where possible, I can suggest areas where my methods have introduced uncertainty:
- While geocoding, there were numerous points without an associated address that were not located. There were also several points that my address locator was not able to differentiate and points were occasionally clustered on one point along a street when the exact location of an address was not found.
- The risk-adjusted nearest neighbour hierarchy tool calculates areas that are based on user input parameters. Output ellipses are abstractions and do not represent actual boundaries.
- Errors that are inherent when using census data: block and tract aggregation data and associated arbitrary boundaries.
- The application of 2010 CT data to foreclosures from 2005-2012.
- My choice of demographic data for regression my not actually reflect the most influential factors.
Further Research
These are topics I wanted to incorporate but fell outside of the scope of this project. They may provide interesting complementary research:
- Wider range of explanatory regression statistics
- Incorporation of mortgage lending data
- Analysis comparing pre- and post-recession patterns