GEOB 472 – Research in Cartography
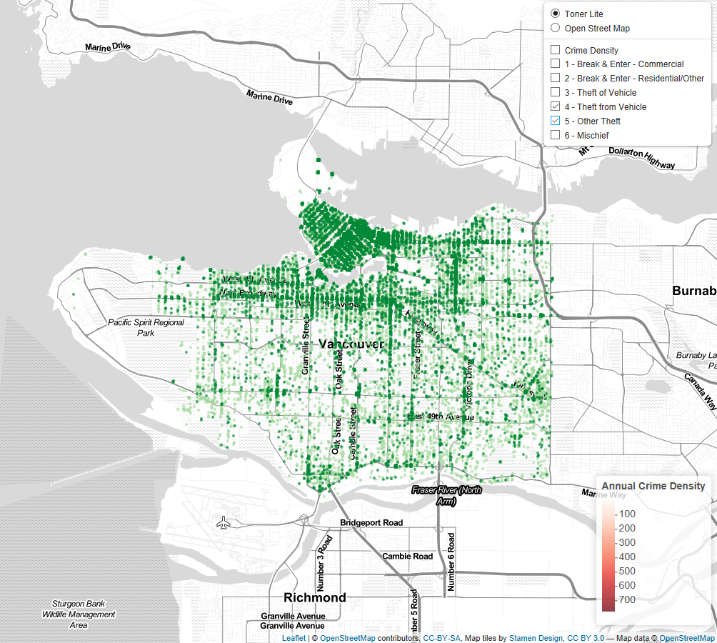
2005 Vancouver Crime Data – Data cleaned and prepared using R then interactive visualisation created using the R Leaflet Package. This screenshot shows the map with theft location layers selected.
Throughout this course I will be exploring the theory behind effective cartographic and infographic design, and developing software and programming skills while putting this theory into practice.
As defined by the course website, students completing this course will:
- understand how visual information is processed, under the influence of perception and cognition, which will enable the design of effective maps and infographics
- be able to approach and plan any geospatial data visualization project using the 7 steps of the data visualization pipeline (Ben Fry): acquire, parse, filter, mine (GIS analysis) represent (map) refine, interact (web mapping).
- learn basic open source programming tools and interactive web mapping tools
- use open source software, in addition to proprietary GIS and mapping software (ArcGIS, Adobe Illustrator) for geospatial data visualization projects (infographics and interactive web maps)
- be able to critically assess products that result from mapping projects
- learn how to work in teams through the geospatial data visualization process
- work with a community partner on a final mapping project