GIS Portfolio – Matt Wagstaff

Quantitative Data Classification

Posted by in Technical

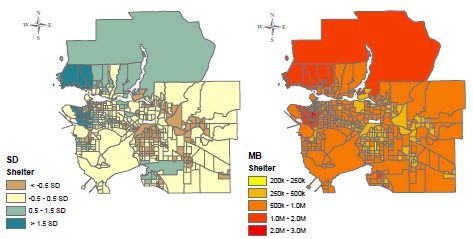
There are a number of different classification methods that you can use in GIS software to present your data and which method you choose may depend on a number of factors. The four most common methods are: Natural Breaks With the natural breaks method, the GIS software calculates natural break points based on the distribution of the data and classifies the data into these bins. Equal Interval The GIS software can also be used for the equal interval method where the data is separated into equal intervals based on the…read more

GEOB 270 Accomplishment Statements So Far

Posted by in Reflection

Gained practical working knowledge of ArcGIS software and worked with a variety of classes of datasets in multiple contexts for geographic analysis. Examined and appropriately repaired geospatial data sets to prepare for further analysis. Created composite images from remote sensing data to examine the effects of the Mt. St. Helens eruption by comparing the surrounding area pre and post-eruption. Used spatial and tabular datasets to create a map to determine and communicate the areas of the City of Vancouver and important facilities that may be at risk from a tsunami.

0

Vancouver – Tsunami Risk Analysis

Posted by in Analysis

Based on our analysis of the risk Vancouver faces from a tsunami, we calculated that 11.35% of the City of Vancouver is under threat in the event of a 10m tsunami wave. This area at risk was found by creating a 1 km buffer around the shoreline of the city and finding the land that sits below 10m elevation in this buffer zone. To calculate a percentage of the city that is at risk, this was simply compared to the area of the city itself. Within this at risk zone…read more

Remotely Sensed Landsat Data and Geographic Analysis

Posted by in Technical

Landsat data is extremely useful for geographical analysis that aims to measure large visible changes in any system over time. Collecting data on this sort of scale by any other method is bascially unfeasible. A good example of analysis that Landsat data can be used to perform would be looking at the change in sea ice cover in the Arctic. You could use the data to explore infinite questions in terms of how the ice cover is changing based on different time scales etc. One example would be measuring the…read more

0

Fixing Misaligned and Improperly Referenced Spatial Data

Posted by in Technical

When working with spatial data you have to be very careful with matching the geographic coordinate systems and projections of your data. When a dataset is projected, 4 properties are affected and therefore you need to work with the right projections to minimize the distortion of the properties you are interested in studying. These 4 properties that are affected are: Area Shape Distance Direction When working with new data you should carefully check the data before proceeding with any map creation or analysis. Here is a suggestion for a protocol…read more

0

Spam prevention powered by Akismet