GIS Portfolio – Matt Wagstaff

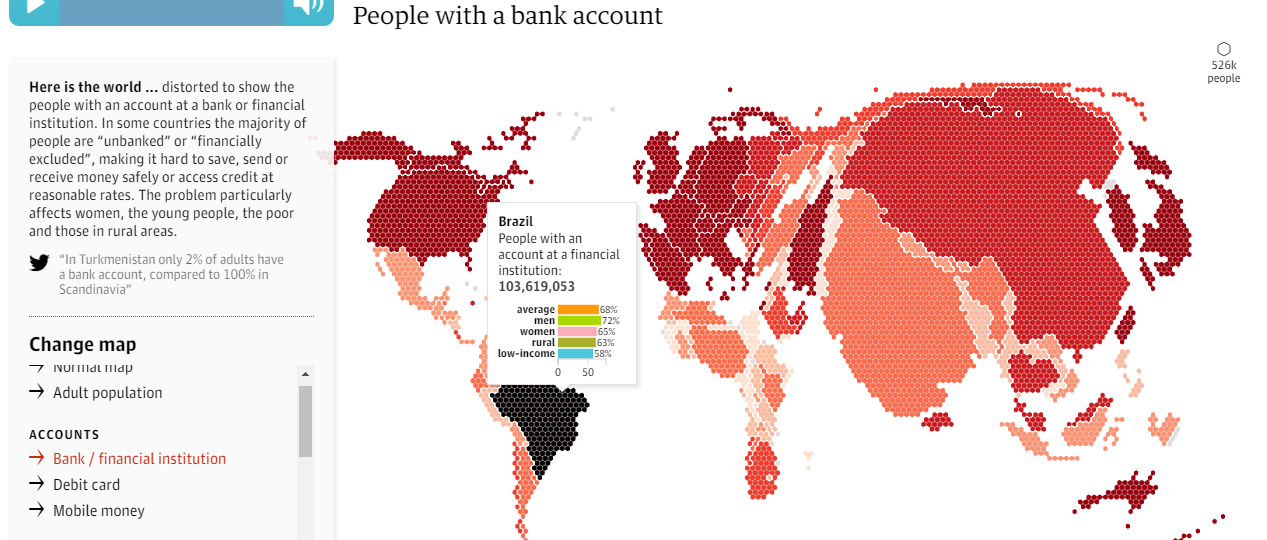
472 – Interactive Map Deconstruction – The Financial Inclusion Map

Posted by in Analysis, Reflection

The Financial Inclusion Map: https://www.theguardian.com/global-development-professionals-network/ng-interactive/2015/nov/19/who-saves-the-least-money-financial-exclusion-around-the-world-interactive-borrowing-savings-finance This map was created by an interactive studio/company based in the UK called Kiln (https://www.kiln.digital/) to be published on the website of The Guardian newspaper. The studio has made many interesting and varied data visualisations that can be viewed on their website such as the carbon map (http://www.carbonmap.org/) and the digital divide (http://scidev.live.kiln.digital/digitaldivide/). The author of the map and the data source are listed clearly at the bottom of the map with links to these pages. The data to create the map was sourced from…read more

472 – Interactive Visualisations – Vancouver Crime Data 2005

Posted by in Analysis, Reflection, Technical

For this assignment we were tasked with creating an interactive map that can be posted online to visualise Vancouver Crime data. Cleaning and filtering the raw crime data for the map was conducted using the open source R coding language and RStudio software, and the actual maps were produced using the add-on package ‘leaflet’ (https://rstudio.github.io/leaflet/). To tackle this assignment I followed Ben Fry’s data visualisation pipeline and I will use this framework to explain how my R code converts the original data set into an interactive map. To avoid repeating…read more

472 – Syrian Refugee Infographic

Posted by in Analysis, Reflection

The Syrian conflict and associated refugee crisis has been ongoing since 2011 with many countries receiving applications from displaced persons for refugee status. While many Western countries have made pledges to assist these displaced Syrians, have their actions lived up to these words? As part of an assignment for GEOB 472 we were tasked with producing an infographic that could accompany an article on the status of Syrian refugee claims in various countries, in a publication such as The Globe and Mail. The objective of this infographic was to help Canadian…read more

Geospatial Analysis of the Alberni-Clayoquot Agricultural Land Reserve

Posted by in Analysis, Reflection

Our analysis of the Agricultural Land Reserves (ALR) in the Alberni-Clayoquot Census District can be found at the following link: GEOB270-Alberni-Clayoquot-Final-Report This project was performed to look critically at the current situation of British Columbia’s ALRs. As the name implies, ALRs are land that has been set aside mainly to be used for agricultural purposes by the provincial government. As a class we worked in groups to assess the ALRs of individual census districts to examine how the land is actually being used in these areas and also the suitability of…read more

Environmental Assessments – Garibaldi at Squamish

Posted by in Analysis

  For this project we performed an environmental assessment of the proposed Garibaldi at Squamish ski resort that is located on Brohm Ridge on the slopes of Mt. Garibaldi above Squamish and sits right on the border of Garibaldi Provincial Park. We evaluated how a number of environmental concerns would affect the proposed project area, including the altitude, old growth management areas, river riparian areas, the winter range of ungulates and the ecosystems of red-listed plant species. The results can be seen in the map below: As part of the…read more

Housing Affordability Analysis: Vancouver vs Montreal

Posted by in Analysis

These maps were created to analyze the affordability of housing in the metro areas of Vancouver and Montreal. Affordability metrics were calculated by normalising median house prices for each census tract to the median household income. Measuring affordability in this way rather than simply analysing housing cost is a better indicator of affordability as it also takes into account differences in average income between census tracts. It is clear that the majority of Metro Vancouver now falls into the severely unaffordable category and it is in fact one of the…read more

Vancouver – Tsunami Risk Analysis

Posted by in Analysis

Based on our analysis of the risk Vancouver faces from a tsunami, we calculated that 11.35% of the City of Vancouver is under threat in the event of a 10m tsunami wave. This area at risk was found by creating a 1 km buffer around the shoreline of the city and finding the land that sits below 10m elevation in this buffer zone. To calculate a percentage of the city that is at risk, this was simply compared to the area of the city itself. Within this at risk zone…read more

Spam prevention powered by Akismet