GIS Portfolio – Matt Wagstaff

472 – Creating Interactive Maps with Carto

Posted by in Technical

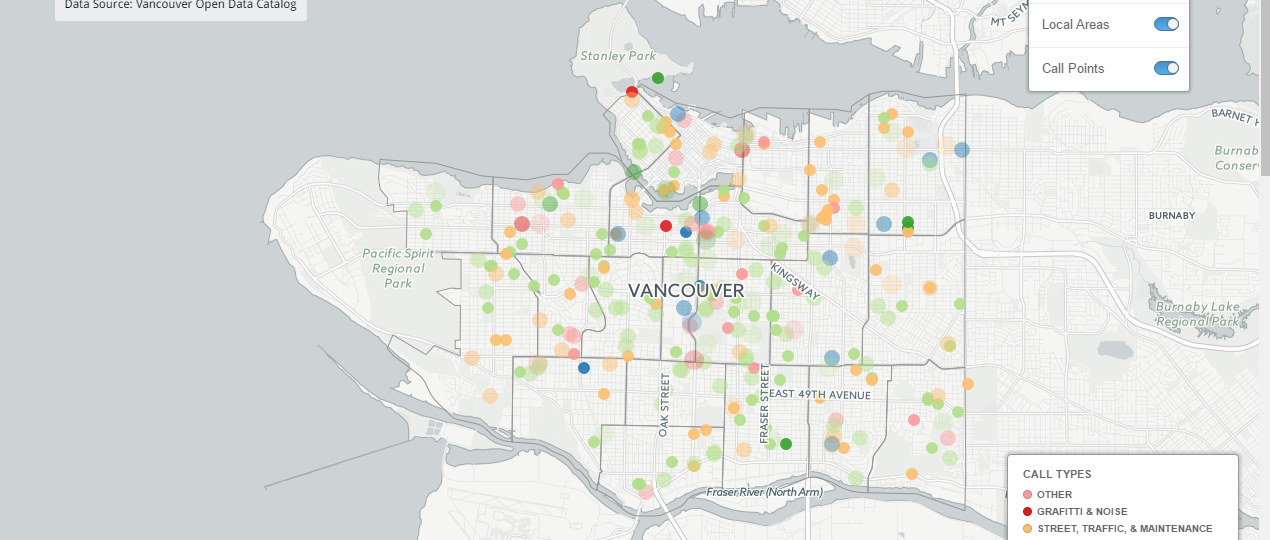
Carto (formerly known as Carto DB) is an online platform for mapping data. As with many online services, it is free to use to create maps but free accounts have limits, to create maps with large data sets or certain features, you will have to pay for a subscription. The platform is very easy to use and fairly intuitive. To practice using the platform we created new interactive maps to visualise the Vancouver 311 calls data, but this time had to limit the dataset to just a single month of data…read more
472 – Interactive Visualisations – Vancouver Crime Data 2005

Posted by in Analysis, Reflection, Technical

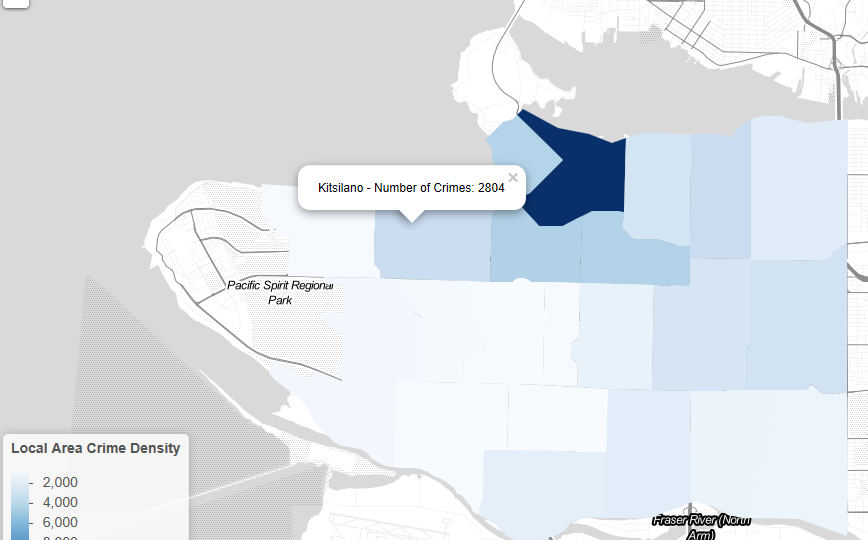
For this assignment we were tasked with creating an interactive map that can be posted online to visualise Vancouver Crime data. Cleaning and filtering the raw crime data for the map was conducted using the open source R coding language and RStudio software, and the actual maps were produced using the add-on package ‘leaflet’ (https://rstudio.github.io/leaflet/). To tackle this assignment I followed Ben Fry’s data visualisation pipeline and I will use this framework to explain how my R code converts the original data set into an interactive map. To avoid repeating…read more

472 Assignment 2 – Creating Art with Processing

Posted by in Technical

In this assignment we were first tasked with recreating a Proun drawing by El Lissitzsky, using the Processing software and coding language. The original drawing is shown on the left below, with my recreation created using Processing juxtaposed on the right.  We were then tasked to ‘remix’ the image, using variables such as the user’s input with the mouse to change aspects of the drawing. I edited my script so that the drawing would draw as usual if the user did not touch the mouse, but if the mouse is pressed,…read more

Quantitative Data Classification

Posted by in Technical

There are a number of different classification methods that you can use in GIS software to present your data and which method you choose may depend on a number of factors. The four most common methods are: Natural Breaks With the natural breaks method, the GIS software calculates natural break points based on the distribution of the data and classifies the data into these bins. Equal Interval The GIS software can also be used for the equal interval method where the data is separated into equal intervals based on the…read more

Remotely Sensed Landsat Data and Geographic Analysis

Posted by in Technical

Landsat data is extremely useful for geographical analysis that aims to measure large visible changes in any system over time. Collecting data on this sort of scale by any other method is bascially unfeasible. A good example of analysis that Landsat data can be used to perform would be looking at the change in sea ice cover in the Arctic. You could use the data to explore infinite questions in terms of how the ice cover is changing based on different time scales etc. One example would be measuring the…read more

0

Fixing Misaligned and Improperly Referenced Spatial Data

Posted by in Technical

When working with spatial data you have to be very careful with matching the geographic coordinate systems and projections of your data. When a dataset is projected, 4 properties are affected and therefore you need to work with the right projections to minimize the distortion of the properties you are interested in studying. These 4 properties that are affected are: Area Shape Distance Direction When working with new data you should carefully check the data before proceeding with any map creation or analysis. Here is a suggestion for a protocol…read more

0

Spam prevention powered by Akismet