GIS Portfolio – Matt Wagstaff

472 – Creating Interactive Maps with Carto

Posted by in Technical

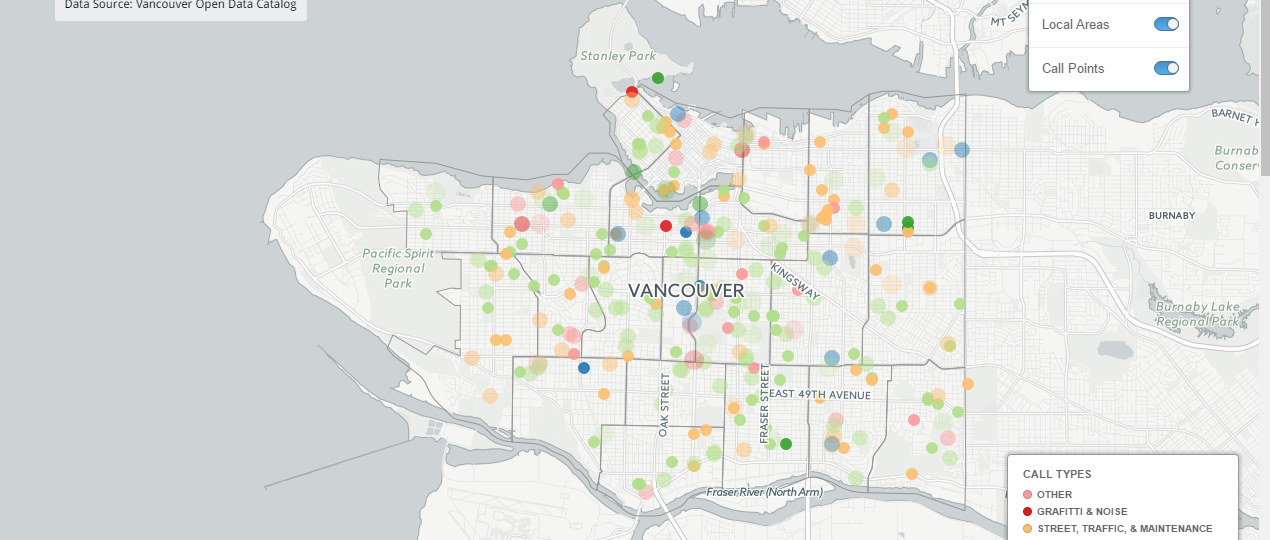
Carto (formerly known as Carto DB) is an online platform for mapping data. As with many online services, it is free to use to create maps but free accounts have limits, to create maps with large data sets or certain features, you will have to pay for a subscription. The platform is very easy to use and fairly intuitive. To practice using the platform we created new interactive maps to visualise the Vancouver 311 calls data, but this time had to limit the dataset to just a single month of data…read more
472 – Interactive Map Deconstruction – The Financial Inclusion Map

Posted by in Analysis, Reflection

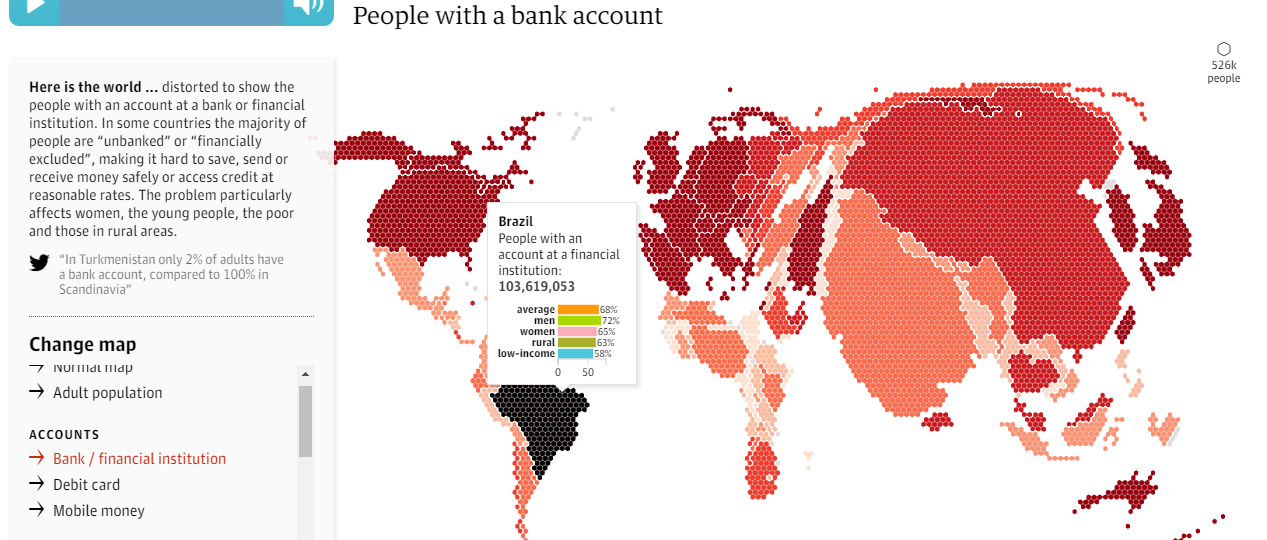
The Financial Inclusion Map: https://www.theguardian.com/global-development-professionals-network/ng-interactive/2015/nov/19/who-saves-the-least-money-financial-exclusion-around-the-world-interactive-borrowing-savings-finance This map was created by an interactive studio/company based in the UK called Kiln (https://www.kiln.digital/) to be published on the website of The Guardian newspaper. The studio has made many interesting and varied data visualisations that can be viewed on their website such as the carbon map (http://www.carbonmap.org/) and the digital divide (http://scidev.live.kiln.digital/digitaldivide/). The author of the map and the data source are listed clearly at the bottom of the map with links to these pages. The data to create the map was sourced from…read more

472 – Interactive Visualisations – Vancouver Crime Data 2005

Posted by in Analysis, Reflection, Technical

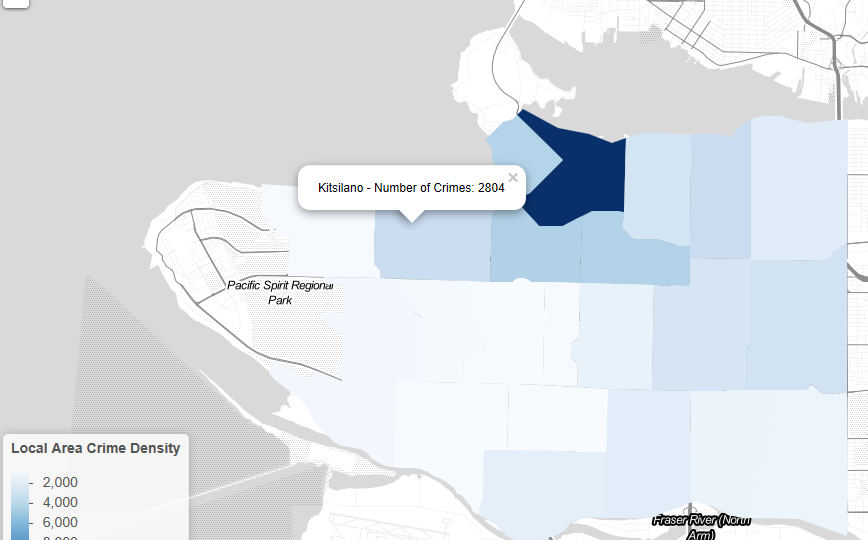
For this assignment we were tasked with creating an interactive map that can be posted online to visualise Vancouver Crime data. Cleaning and filtering the raw crime data for the map was conducted using the open source R coding language and RStudio software, and the actual maps were produced using the add-on package ‘leaflet’ (https://rstudio.github.io/leaflet/). To tackle this assignment I followed Ben Fry’s data visualisation pipeline and I will use this framework to explain how my R code converts the original data set into an interactive map. To avoid repeating…read more

472 – Syrian Refugee Infographic

Posted by in Analysis, Reflection

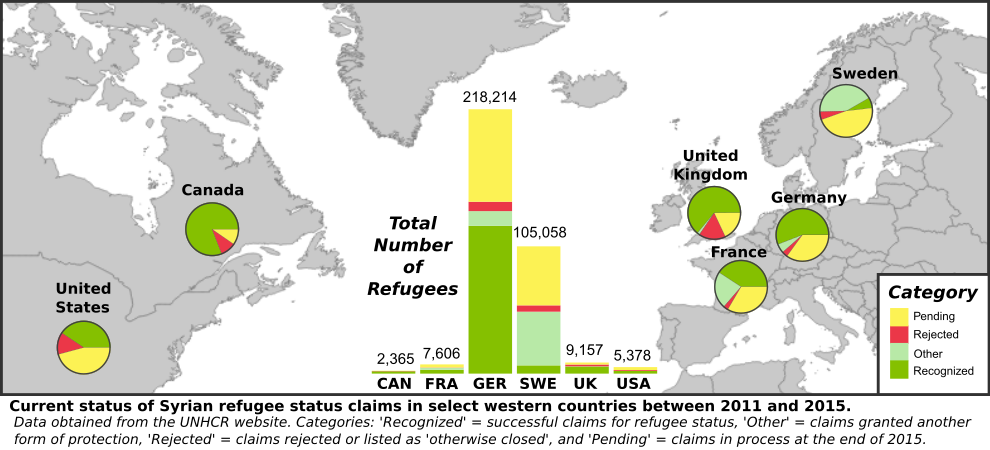
The Syrian conflict and associated refugee crisis has been ongoing since 2011 with many countries receiving applications from displaced persons for refugee status. While many Western countries have made pledges to assist these displaced Syrians, have their actions lived up to these words? As part of an assignment for GEOB 472 we were tasked with producing an infographic that could accompany an article on the status of Syrian refugee claims in various countries, in a publication such as The Globe and Mail. The objective of this infographic was to help Canadian…read more

472 Assignment 2 – Creating Art with Processing

Posted by in Technical

In this assignment we were first tasked with recreating a Proun drawing by El Lissitzsky, using the Processing software and coding language. The original drawing is shown on the left below, with my recreation created using Processing juxtaposed on the right.  We were then tasked to ‘remix’ the image, using variables such as the user’s input with the mouse to change aspects of the drawing. I edited my script so that the drawing would draw as usual if the user did not touch the mouse, but if the mouse is pressed,…read more

Spam prevention powered by Akismet