

Bad news first people.
If you so desire to add yet another online resource (I did not say “tool” Jenny!) and you decide that Piktochart turns your crank, well you have to open yet another account with another user name and another password that you will undoubtedly forget. When is someone going to do a 10 Minutes of Fame on how to create, organize, cleverly disguise and remember all of our user names and passwords? There must be an app or Web 2.0 tool for that! But I digress…
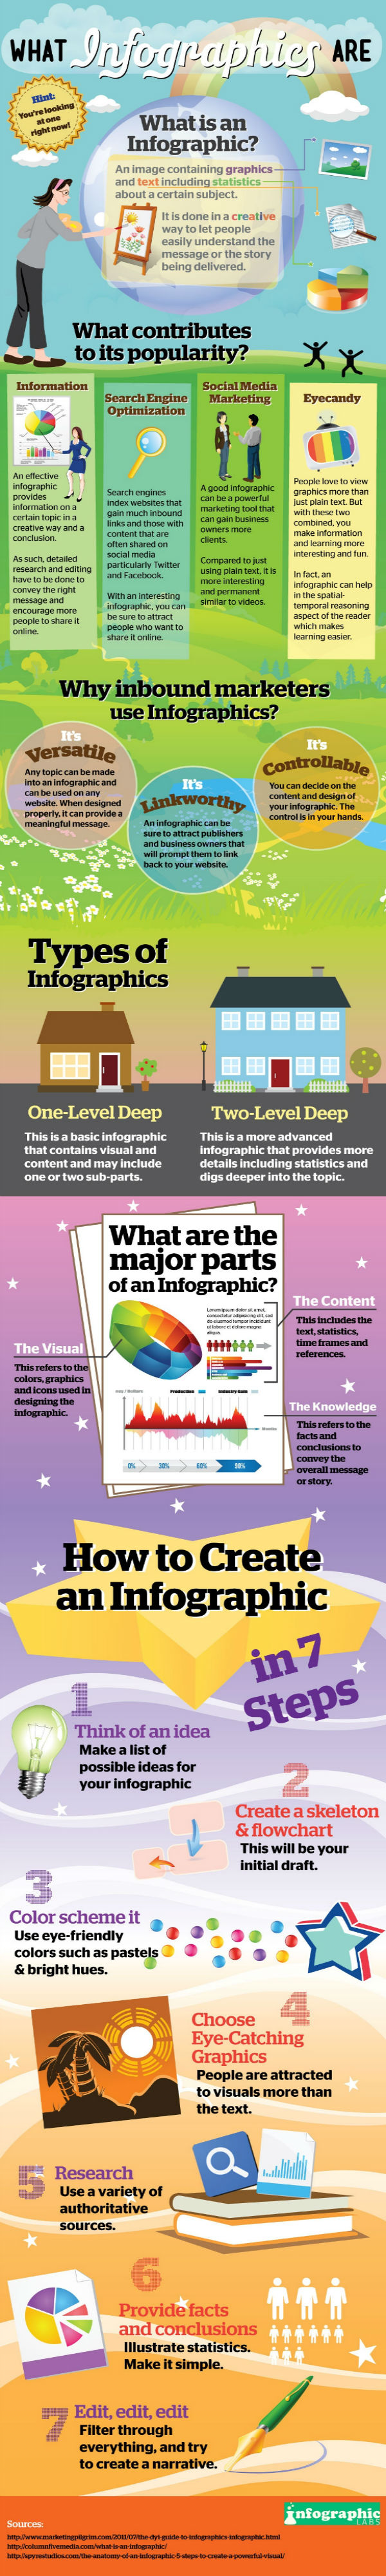
Why should you use infographics?
- To make a grand impression on your course instructor of course! You know you are going to be asked to collect data on fill in blank so how are you going to present all your Survey Monkey info? And then you are going to be asked to conduct a school/community analysis too, statistics included.
- Powerful marketing tool to advocate for you, your library and the integral role it plays in your school community.
- How about an infographic instead of the usual brochure outlining all one needs to know about your library? Hours of operation, number of books you can take out, how to renew your book etc….
- You know that Annual Report you may or may not have to hand in to your Administrator come the end of the school year…well, let’s face it, it’s going to contain some pretty boring stats about circulation. Important info no doubt, but how do you deliver it in a compelling way?
- Kind of like a digital poster but not as busy as Glogster can potentially be.
- Once you’ve completed your infographic you can export and share it as a PNG or JPEG, convert it to a PDF or whatever which means you don’t have to rely on the internet to access it. (VSB colleagues, I know you are picking up what I’m putting down here!)
- Great way to create a “how to” or “tips list” (possibly a how to access and use databases for your students) or Top 10 books of the month list.
What are some of the online resources available to create infographics?
- Piktochart
- 7 free themes, access all charts, 10 image upload shots, Piktochart branded
- lots of ready made tools, drag and drop approach, user-friendly
- Here is my first Piktochart (created with old version).
Churchill Secondary Infographic
- Visual.ly
- must authorize via Twitter or Facebook
- Easel.ly
- drag and drop approach
- not able to insert charts
- Venngage
- lets you track the analytics of who is viewing your infographic
- could be used for classroom of students who want to see who can make the most popular infographic
Some cool infographics for teacher-librarians:
Improve your Google Search Skills from How-to-Geek

27 things teacher-librarians do from educators technology.com

A very informative session on infographics! The challenge is making an infographic is, that, although the information appears in a condensed, simplified form, there is a lot of work that goes into distilling information into a few salient points. I think using infographics would be a great way to teach critical thinking, information processing, analysis, discussion and conclusions.