This week’s assignment was a large challenge for me. I watched the assigned videos about how data is networked and linked, but when presented with the visualization of our entered data from week 8, it was quite overwhelming. I have a fairly large computer monitor, but found myself longing for a much larger screen to spread out the graph so that I could see the connections more clearly. I played with the interface a bit, trying to follow the links and decipher the meanings behind the sizes of the nodes and how everything was connected.
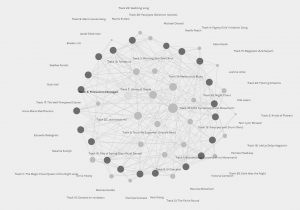
My next step was to separate my name out and then gradually add more curators to build more and more connections and watch now the networks grew. I organized the graphic to put the curators in a circle and then the most popular tracks in the center of the circle.
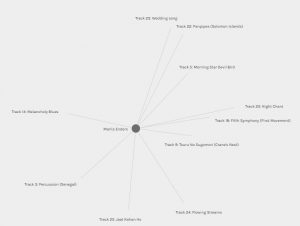
I found it interesting how some tracks came out as fast favourites – such as ‘Fifth Symphony’ and ‘Melancholy Blues’. The ‘percussion’ track from Senegal, and ‘Jaat Kahan Ho’ also seemed to be popular choices. The original selection of the 10 tracks didn’t have much in the way of concrete parameters or criteria so I read the reasonings my classmates wrote on their week 8 blogs. Much selection was based more upon personal preference, auditory appeal, evoked emotions, and seemingly to a lesser degree on representing different instrumentation or musical diversity – possibly representative of the often expressed limited musical theoretical knowledge in the class. Since there was a large Eurocentric representation of material in the original list, the multicultural element was already limited as well. The most popular piece on the list, the Fifth Symphony also seemed to be the most familiar. The least popular songs were most likely those that didn’t appeal to the emotions or weren’t as pleasing as the more popular ones. Considering the number of people in the class having to choose 10 out of 27 songs, the number of possible combinations (considering the absence of concrete parameters) is astronomical, especially with the huge diversity of cultures and backgrounds of the curators, but there are some elements of some songs that seemed to have a wide appeal.
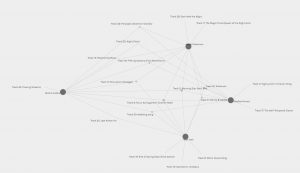
As for the community, I was in a group with 3 other people, and there were only 2 songs that all 4 of us had chosen. Out of the others, 6 songs were connected to three of us, and 3 were connected to only 2 of us. The rest were all just orphan lines that had no other connections in this group.
Comparing to other groups, I couldn’t really seem to see much evidence to indicate what criteria the computer algorithm used to group people together. Some groups (such as group 0) had a few more commonalities and connections between them than we did whereas other groups (such as group 2) had fewer. Unlike in a search engine where context and repetitive occurrences can be derived and used to find appropriate links and connections, there are no defined parameters or commonalities to go from here, so the program is developing its own criteria to group people together. This criteria is not immediately evident.
Emotive appeal and personal preference are not easily quantifiable entities and thus are not easily adaptable for an algorithm exercise such as this.