THE DATA:
The first time I looked at Stanford’s Palladio where each individual and song were plotted on the graph, I thought the data was beautiful as well as overwhelming, like an intricate spider web. When I placed the data into groups, I belonged to Group two with Sarka, Shawn, and Brain.
There are twenty-seven songs in the Golden Record. Brian and I had five songs in common and five that were not. The five songs that I pick that Brian didn’t were El Cascabel, Rite of Spring, Flowing Streams, Dark was the Night, and Pygmy Girls’ Initiation Song. The songs that Brian pick that I didn’t were Melancholy Blues, Magic Flute, Tsuru No Sugomori, Percussion, and Night Chant. Sarka and I also had five songs in common and five songs that were not. I thought it was interesting that three of Sarka’s songs that he picked which I didn’t, had a connection to the songs Brian picked. These songs were Night Chant, Magic Flute, and Percussion. Shawn and I had the strongest connection as we had six songs in common and four songs that were not. The only song that Shawn and I had in common within the group was El Cascabel, while the only song Shawn and Brian had in common was Melancholy Blues. From the graph, the strongest nodes we had as a whole group were the songs Wedding Song, Jaat Kahan Ho, Johnny B. Goode, Morning Star Devil Bird, and Tchakrul.
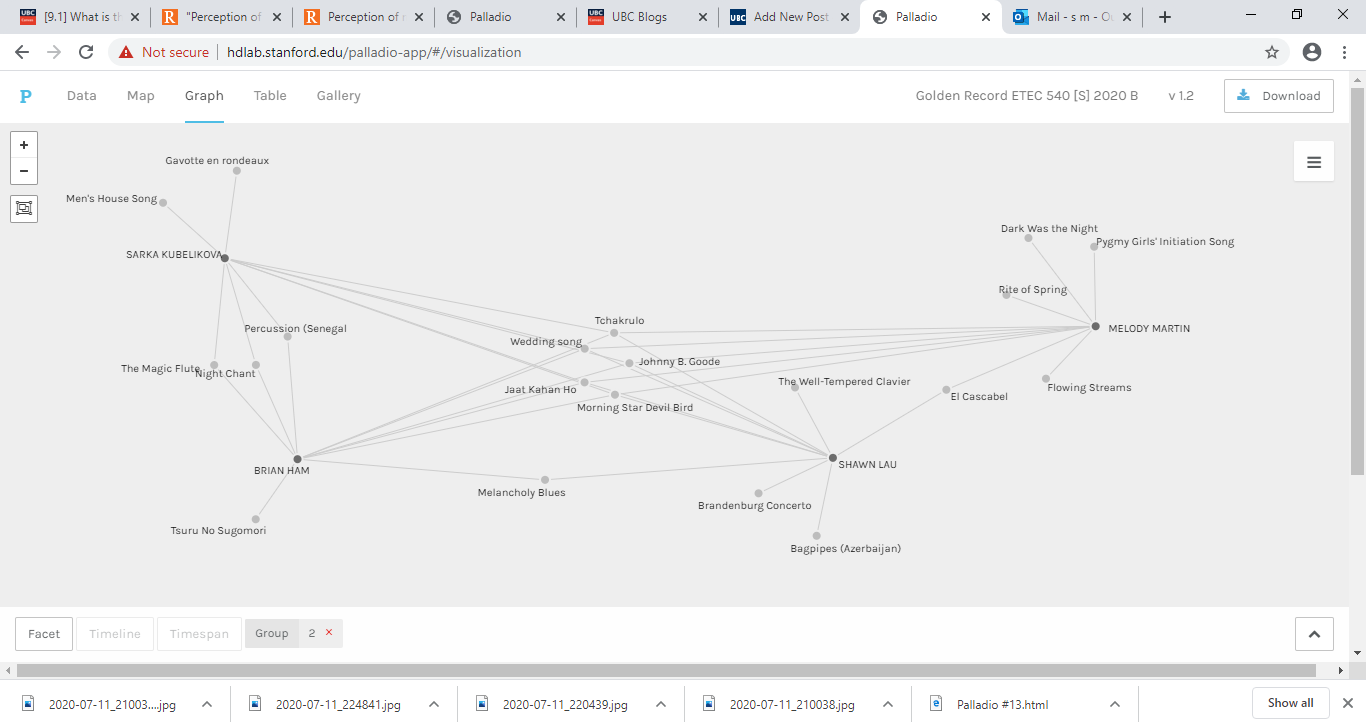
I thought it was interesting that Brian was the only one who had one edge that didn’t have any relation to anyone in the group. I had four songs that wasn’t attach to a node, Shawn had three edges, and Sarka had two edges that wasn’t attach to anyone in the group. I think based on connectivity, Brian would be a central node or network bridge because his edges had more connections to other nodes in our group.

Looking at a macro scale of the graph, this time of the all the groups and songs, the data depicted that some songs were attached to all the groups. These songs were:
-India, raga, “Jaat Kahan Ho,” sung by Surshri Kesar Bai Kerkar
-“Johnny B. Goode, “ written and performed by Chuck Berry
-Australia, Aborigine songs, “Morning Star” and “Devil Bird,” recorded by Sandra LeBrun Holmes
-Beethoven, Fifth Symphony, First Movement, the Philharmonica Orchestra, Otto Klemperer, conductor
-Mexico, “El Cascabel,” performed by Lorenzo Barcelata and the Mariachi Mexico
These songs were important because they were central to all the groups or somehow a network bridge to other nodes. Why ? Unfortunately, it is hard to extrapolate the reason based on the data.
SOME THOUGHTS:
Since the graph delineated connections, I was trying to look at the data based on relationship and the significance of a node in a network. The data was a lot of quantitative information that can be presented in different ways. The graph showed how we are all somehow connected through one node or several nodes to each other and that some nodes are more central and significant than others.
However, the data cannot tell the reason why some songs such as Jaat Kahan Ho or Brian in our group are a central node or a bridge between nodes. Perhaps, it was because the song Jaat Kahan Ho was an incredibly catchy tune? Maybe Brian had a musical background and therefore knowledgeable in picking the songs that would represent the world? These would be assumptions though. What is missing in the data to give it more depth are people’s personal information, their habits, and background history. Without knowing people or interviewing them, the only alternative to gather more information is to search their personal blogs, Instagram, Facebook, and Linkedin account.
Another thing that you cannot obtain from the data are people’s choice and the reason why or why not. In the past, I participated in a yogurt marketing research where we did a taste test. The company created a new type of flavoured yogurt and wanted to unveil it to the market. I w as in part two of the research where the company wanted a sample of the response on the taste and the reason why you would buy the product, why you wouldn’t, and how the company could make the yogurt more appealing. A person’s qualitative response is something that is missing from the data. Having said all this, I thought the Stanford Palladio tool created an elegant graph that was visually friendly to use.
References:
Code.org. (2017, June 13). The Internet: How Search Works . Retrieved from https://youtube/LVV_93mBfSU
Systems Innovation. (2015, April 18). Graph Theory Overview . Retrieved from https://youtube/82zlRaRUsaY
Systems Innovation. (2015, April 19). Network Connections . Retrieved from https://youtube/2iViaEAytxw
Systems Innovation. (2015, April 20). Network Centrality . Retrieved from https://youtube.com/watch?v=NgUj8DEH5Tc&feature=emb_rel_end