To complete the analysis of the geographic relationship between stress and urban greenspace, Indexes of stress and greenness were created to later be used in a Generalized Linear Regression, Geographically Weighted Regression (GWR), and a Spatially Constrained Multivariate Cluster Analysis. Other spatial analysis included a Kernel Density of urban street trees, and choropleth maps of stress and greenness indexes.
Stress Index:
To create the Weighted Stress Index (WSI), 6 factors of stress were chosen from the 2016 Canadian Census. The factors were:
- ‘spending more than 30% income on dwelling’
- ‘no education’
- ‘unemployment rate’
- ‘number divorced’
- ‘recent immigrants’
- ‘income’
These factors of stress were all counts except for ‘unemployment rate‘ and ‘income‘. Therefore, they had to be converted to rates based on the populations of the individual Dissemination Areas (DA). After creating rates for all the stress factors, all of the variables were normalized on a scale of 0-1; where 0 is least stress and 1 is most stress. ‘income’ was normalized inversely so that the highest income would be closest to 0.
After normalizing the stress variables, an Analytical Hierarchical Approach (AHP) was conducted to determine the weights of the variables within the index. The results from this were as follows:
- ‘income‘ = 28.04%
- ‘number divorced‘ = 25.27%
- ‘unemployment‘ = 17.57%
- ‘spending more than 30% income on dwelling’ = 17.07%
- ‘recent immigrants’ = 8.92%
- ‘no education’ = 3.13%
The index was calculated using the weighted mean of the normalized variables. The table including the WSI was then joined with the Vancouver DA shapefile by the ‘DAID’ field.
Greenness Index:
Creating the Weighted Greenness Index (WGI) followed a similar approach as the WSI, scaled from 0-1. 3 factors derived from 3 different datasets were used to create the WGI. The data sets were:
- ‘Metro Vancouver Regional Parks’
- Polygons of the locations and area of Regional Parks in Greater Vancouver
- ‘Vancouver Street Trees’
- Point locations of all street trees in Vancouver
- ‘Vancouver Municipal Parks’
- Polygons of the locations and areas of Municipal Parks in Vancouver
The normalized metrics of greenness for each Vancouver DA were derived from these data sets are:
- ‘Number of Street Trees’
- ‘Distance to Nearest Major Park’
- ‘Area of Minor Park Within DA’
Firstly, to obtain metrics for the number of street trees within each DA, the ‘summarize within’ function was used to count the number of trees within each DA. Then the same function was used to calculate the area (in meters-squared) of each DA that was minor, municipal parks. The areas of Stanley park was excluded from this metric as it is such a significant outlier than it would seriously alter the resulting metric. To find the distance to nearest the nearest major park, a near-table was generated which calculated the distance from each DA to the near Regional Park in meters. The produced near table was then joined with the WGI table containing the other metrics. After obtaining the non-normalized metrics they were all standardized using the ‘standardize field’ function. The normalization of ‘Distance to Nearest Major Park’ was then inversed show the largest distances closest to 0 in the normalization.
After the all the metrics for the WGI were standardized, another AHP was run to determine the weights of each factor. The resulting weights were:
- ‘Area of Minor Park Within DA‘ = 50%
- ‘Distance to Nearest Major Park‘ = 30%
- ‘Number of Street Trees‘ = 20%
From the AHP, the the WGI was then calculated using the weighted average. The WGI and WSI tables were then joined to create one layer containing a table with both the WGI and WSI within the Vancouver Dissemination Areas.
Street Tree Kernel Density:
A kernel density of the street trees in Vancouver was created using a neighborhood size 100m2.
Generalized Linear Regression (GLR)
A GLR was conducted as an exploratory regression for the ‘DA_stress_green’ layer containing the WGI and WSI.
Geographically Weighted Regression (GWR):
The GWR was conducted using continuous (Gaussian) function, using the same ‘DA_stress_green’ layer as the GLR. The output layer from the GWR was then classified using graduated symbols of dots for the local R-squared value for each DA. The output WGI and WSI coefficient raster layer was then used to create the GWR map with the local R-squared layer overlaid on the raster layer.
Spatially Constrained Multivariate Cluster SCMC:
To identify the clusters of the GWR, a SCMC was conducted using the output DA layer of the GWR. The resulting cluster layer was then overlaid with the local R-squared values for the production of the SCMC map which contained the spatially constrained boxplot of the variables.
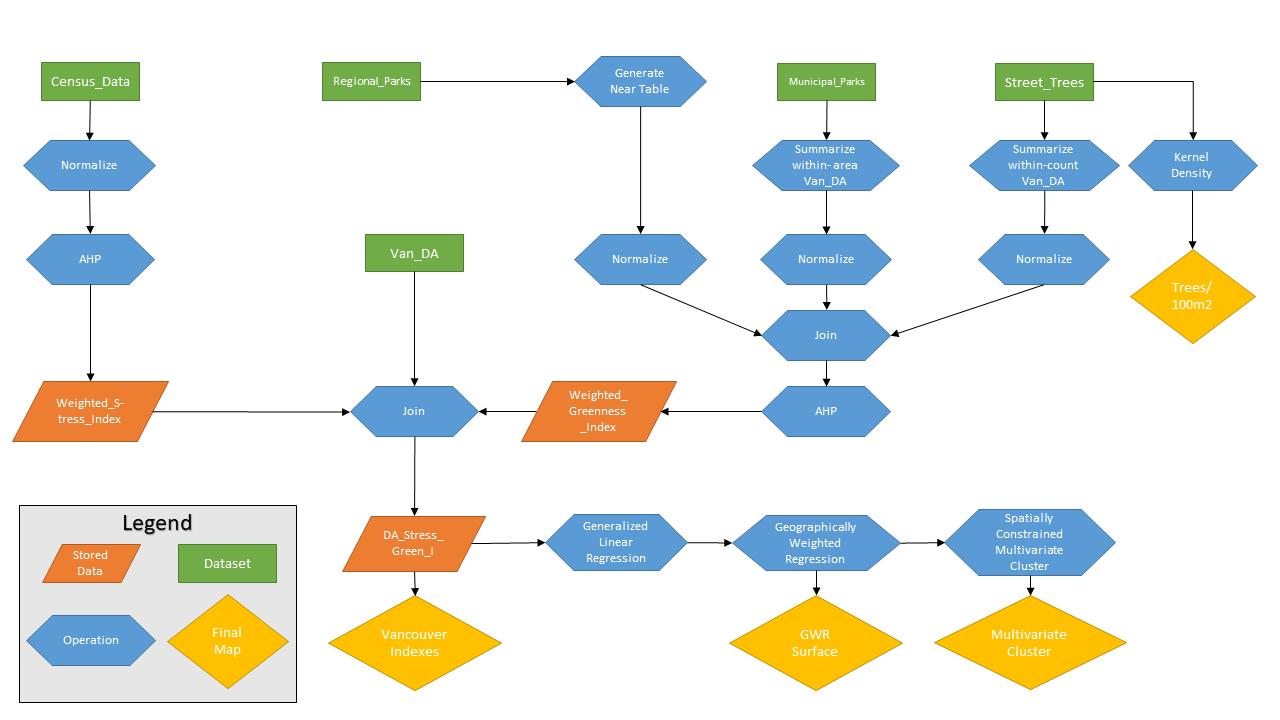
Methodology Flowchart: