Results:
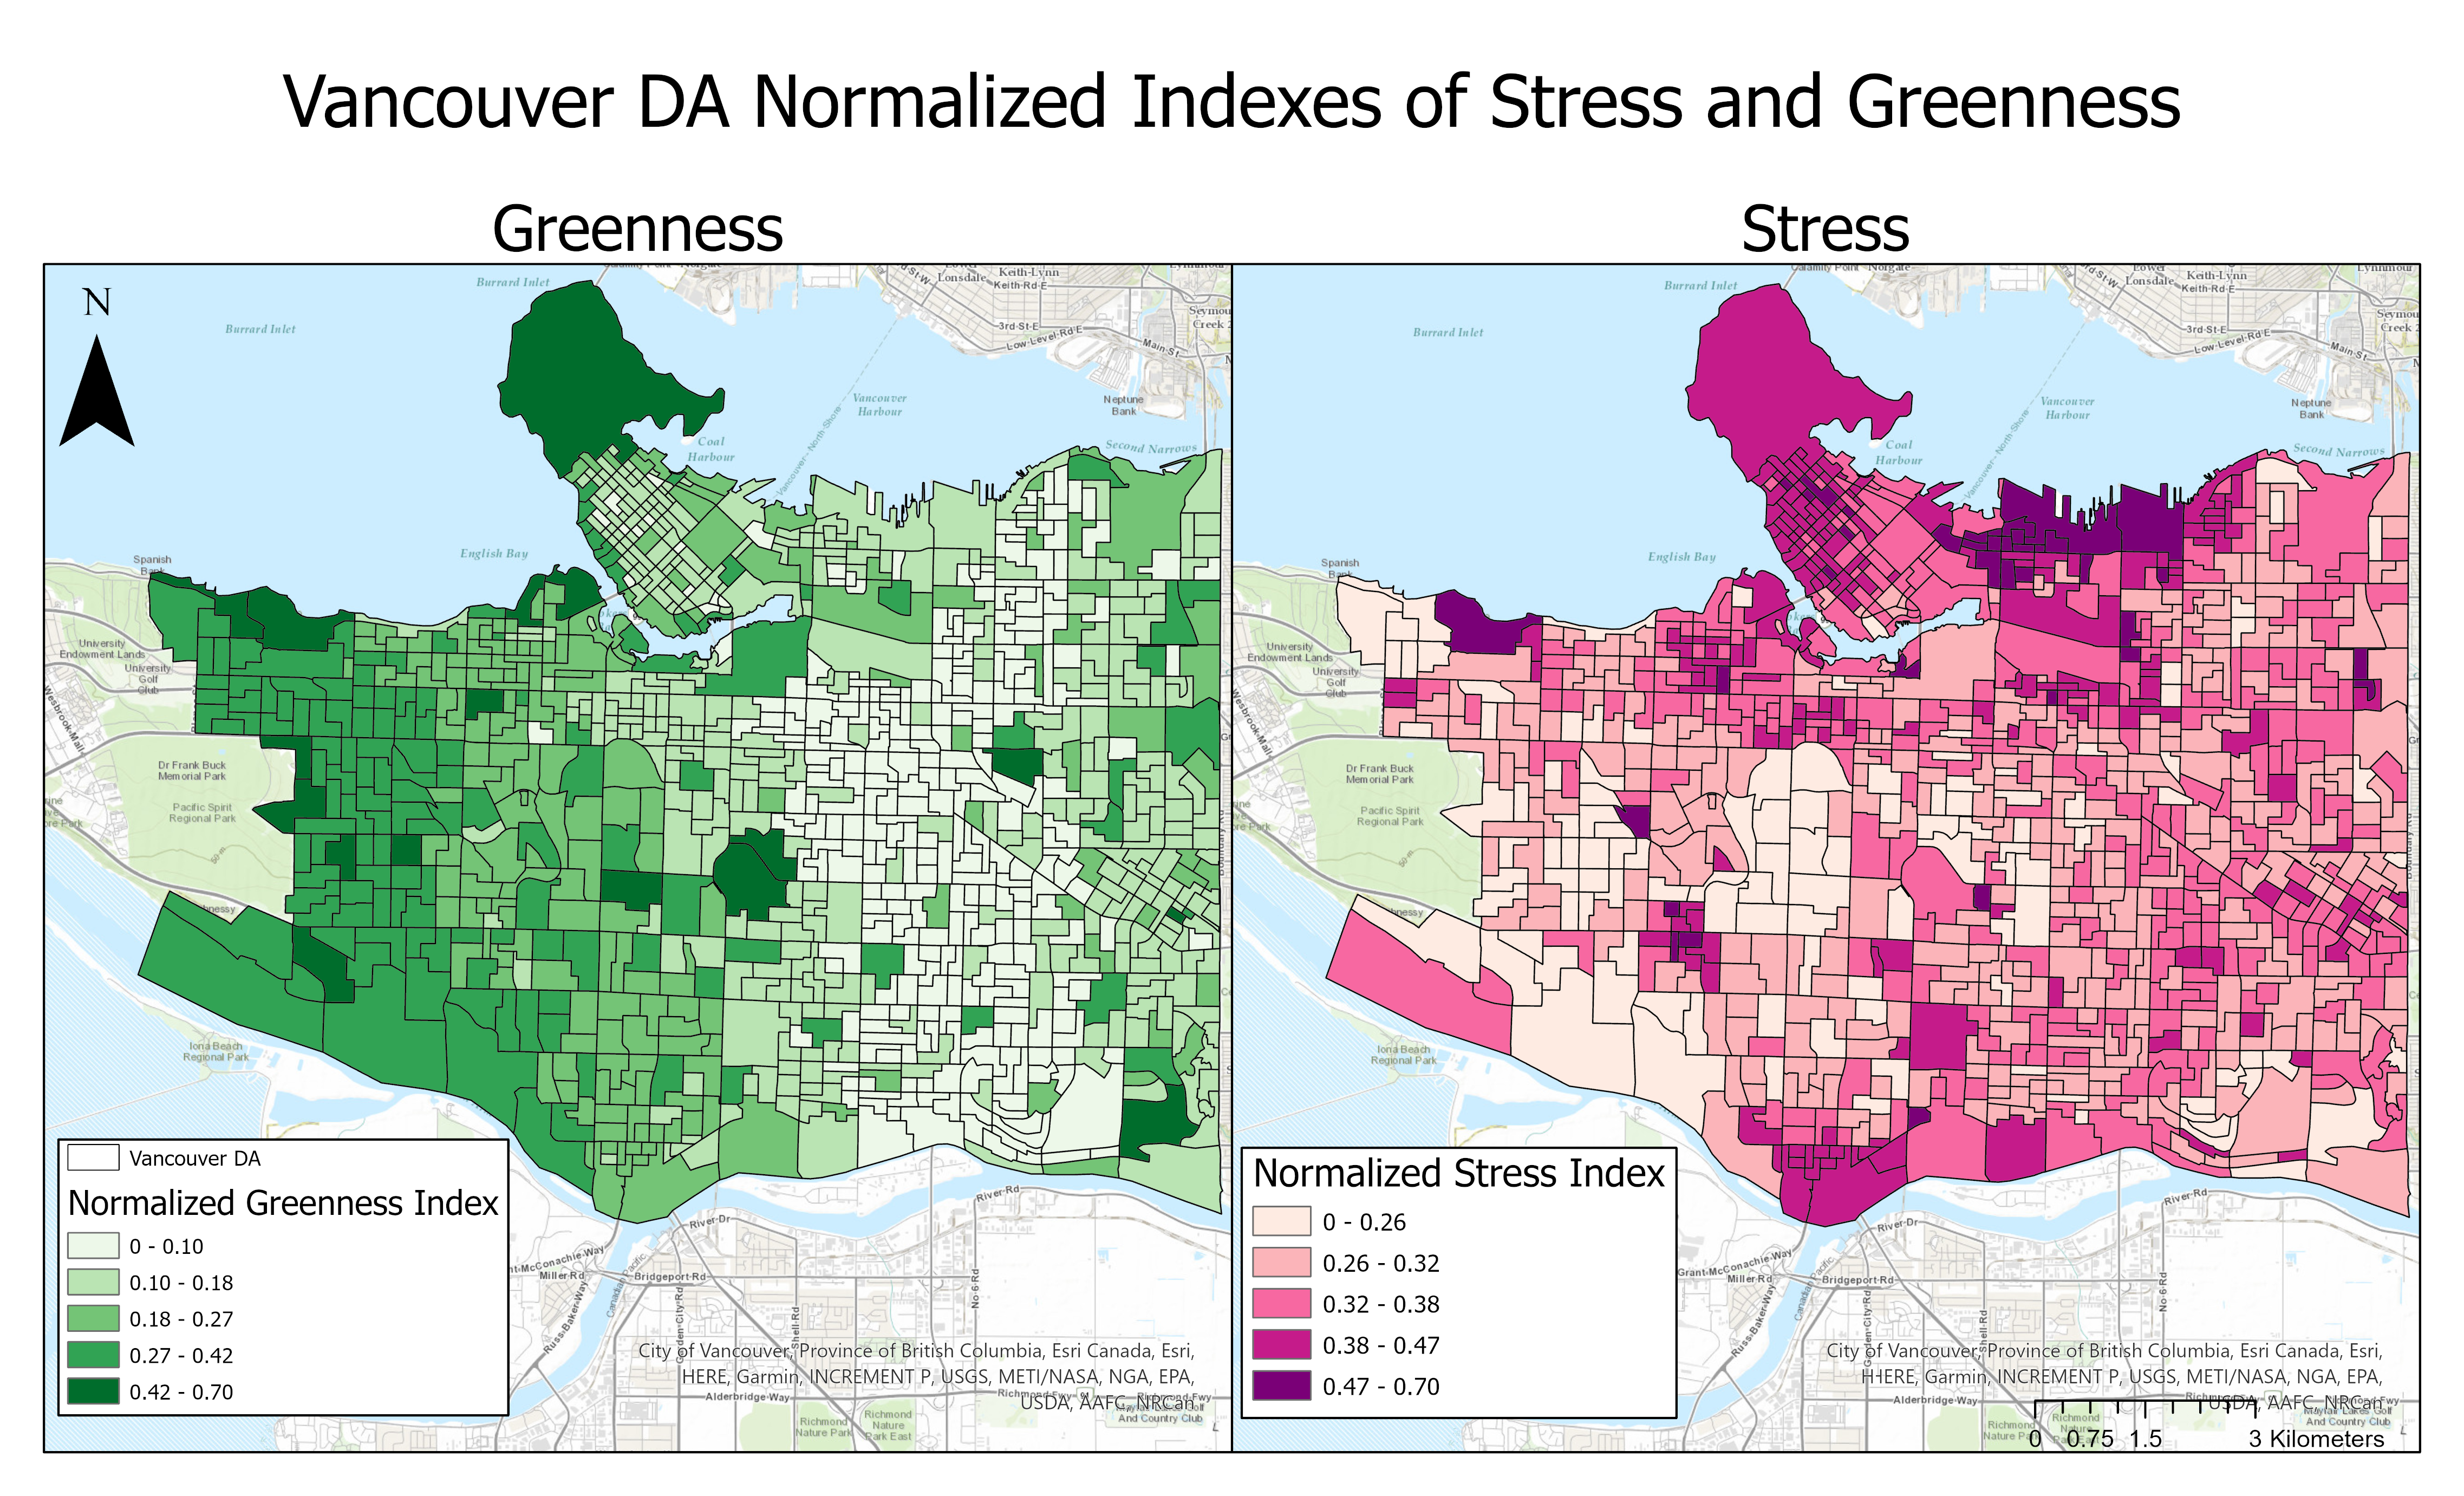
To begin, exploring the “greenness” of Vancouver in Figure 3, it was found that the the highest number of street trees within a 100m2 area in Vancouver was ~42. Additionally the Highest WGI in a DA was in Kitsilano Beach, an of Vancouver area known too be especially affluent. The specific DA had greenness metrics of 0.86 for the closest major park (Pacific Spirit), 0.84 for area of DA that was a municipal park, however 0.08 for the number of street trees. When looking at the “stress’ of Vancouver, again in Figure 3, there were two DAs with a WSI of 0.55, both of these DAs were located in the Downtown Eastside(DTES) of Vancouver. The metrics of stress within these DAs were especially high in income (1.0 and 0.96), and unemployment ( 0.75, and 0.91). The GWI for these to DAs were 0.1 and 0.08, respectively. The observed relationship between socio-economic factors and WGI is in line with observations of Mills et. al in the U.K. where the “greenest” areas in a city coincide with the highest income and land values.
Results from running the exploratory GLR indicated a negative correlation of -0.11 between the WSI and WGI of a DA. These metrics from the GLR do not show that there is not very large correlation between the two variables, however the resulting P-value was <0.05, therefore indicating results were statistically significant.
The results from the GWR showed a low end of Local R-squared to be 0.12 and a high end to be 0.46. (Figure 2). Therefore, the regression was not overall very strong. The coefficient surface of the GWR however shows that there were strongest negative correlations between WGI and WSI in the DTES and the Southwestern side of the city near South Dunbar and Marlpool. The regression also tended to work best in the areas surrounding the downtown core, with pockets in the placed throughout the rest of the city.
The SCMC (Figure 1) identified four distinct clusters, the most significant clusters were areas 1 and 2. Being opposites. Cluster 1 contained the highest WSI, and the second lowest WGI, where as Cluster 2 contained the highest WGI and the second lowest WSI. These clusters non-coincidentally contain the aforementioned DA in Kitsilano with high WGI and income, and the DTES DA with some of the lowest WGIs and highest WSI. Cluster 3 also had a high degree of greenness and a low degree of stress, this area also non-coincidentally is a more affluent part of the city. Cluster 4 however, had relatively similar WGI and WSI.
Figure 1: SCMC Map
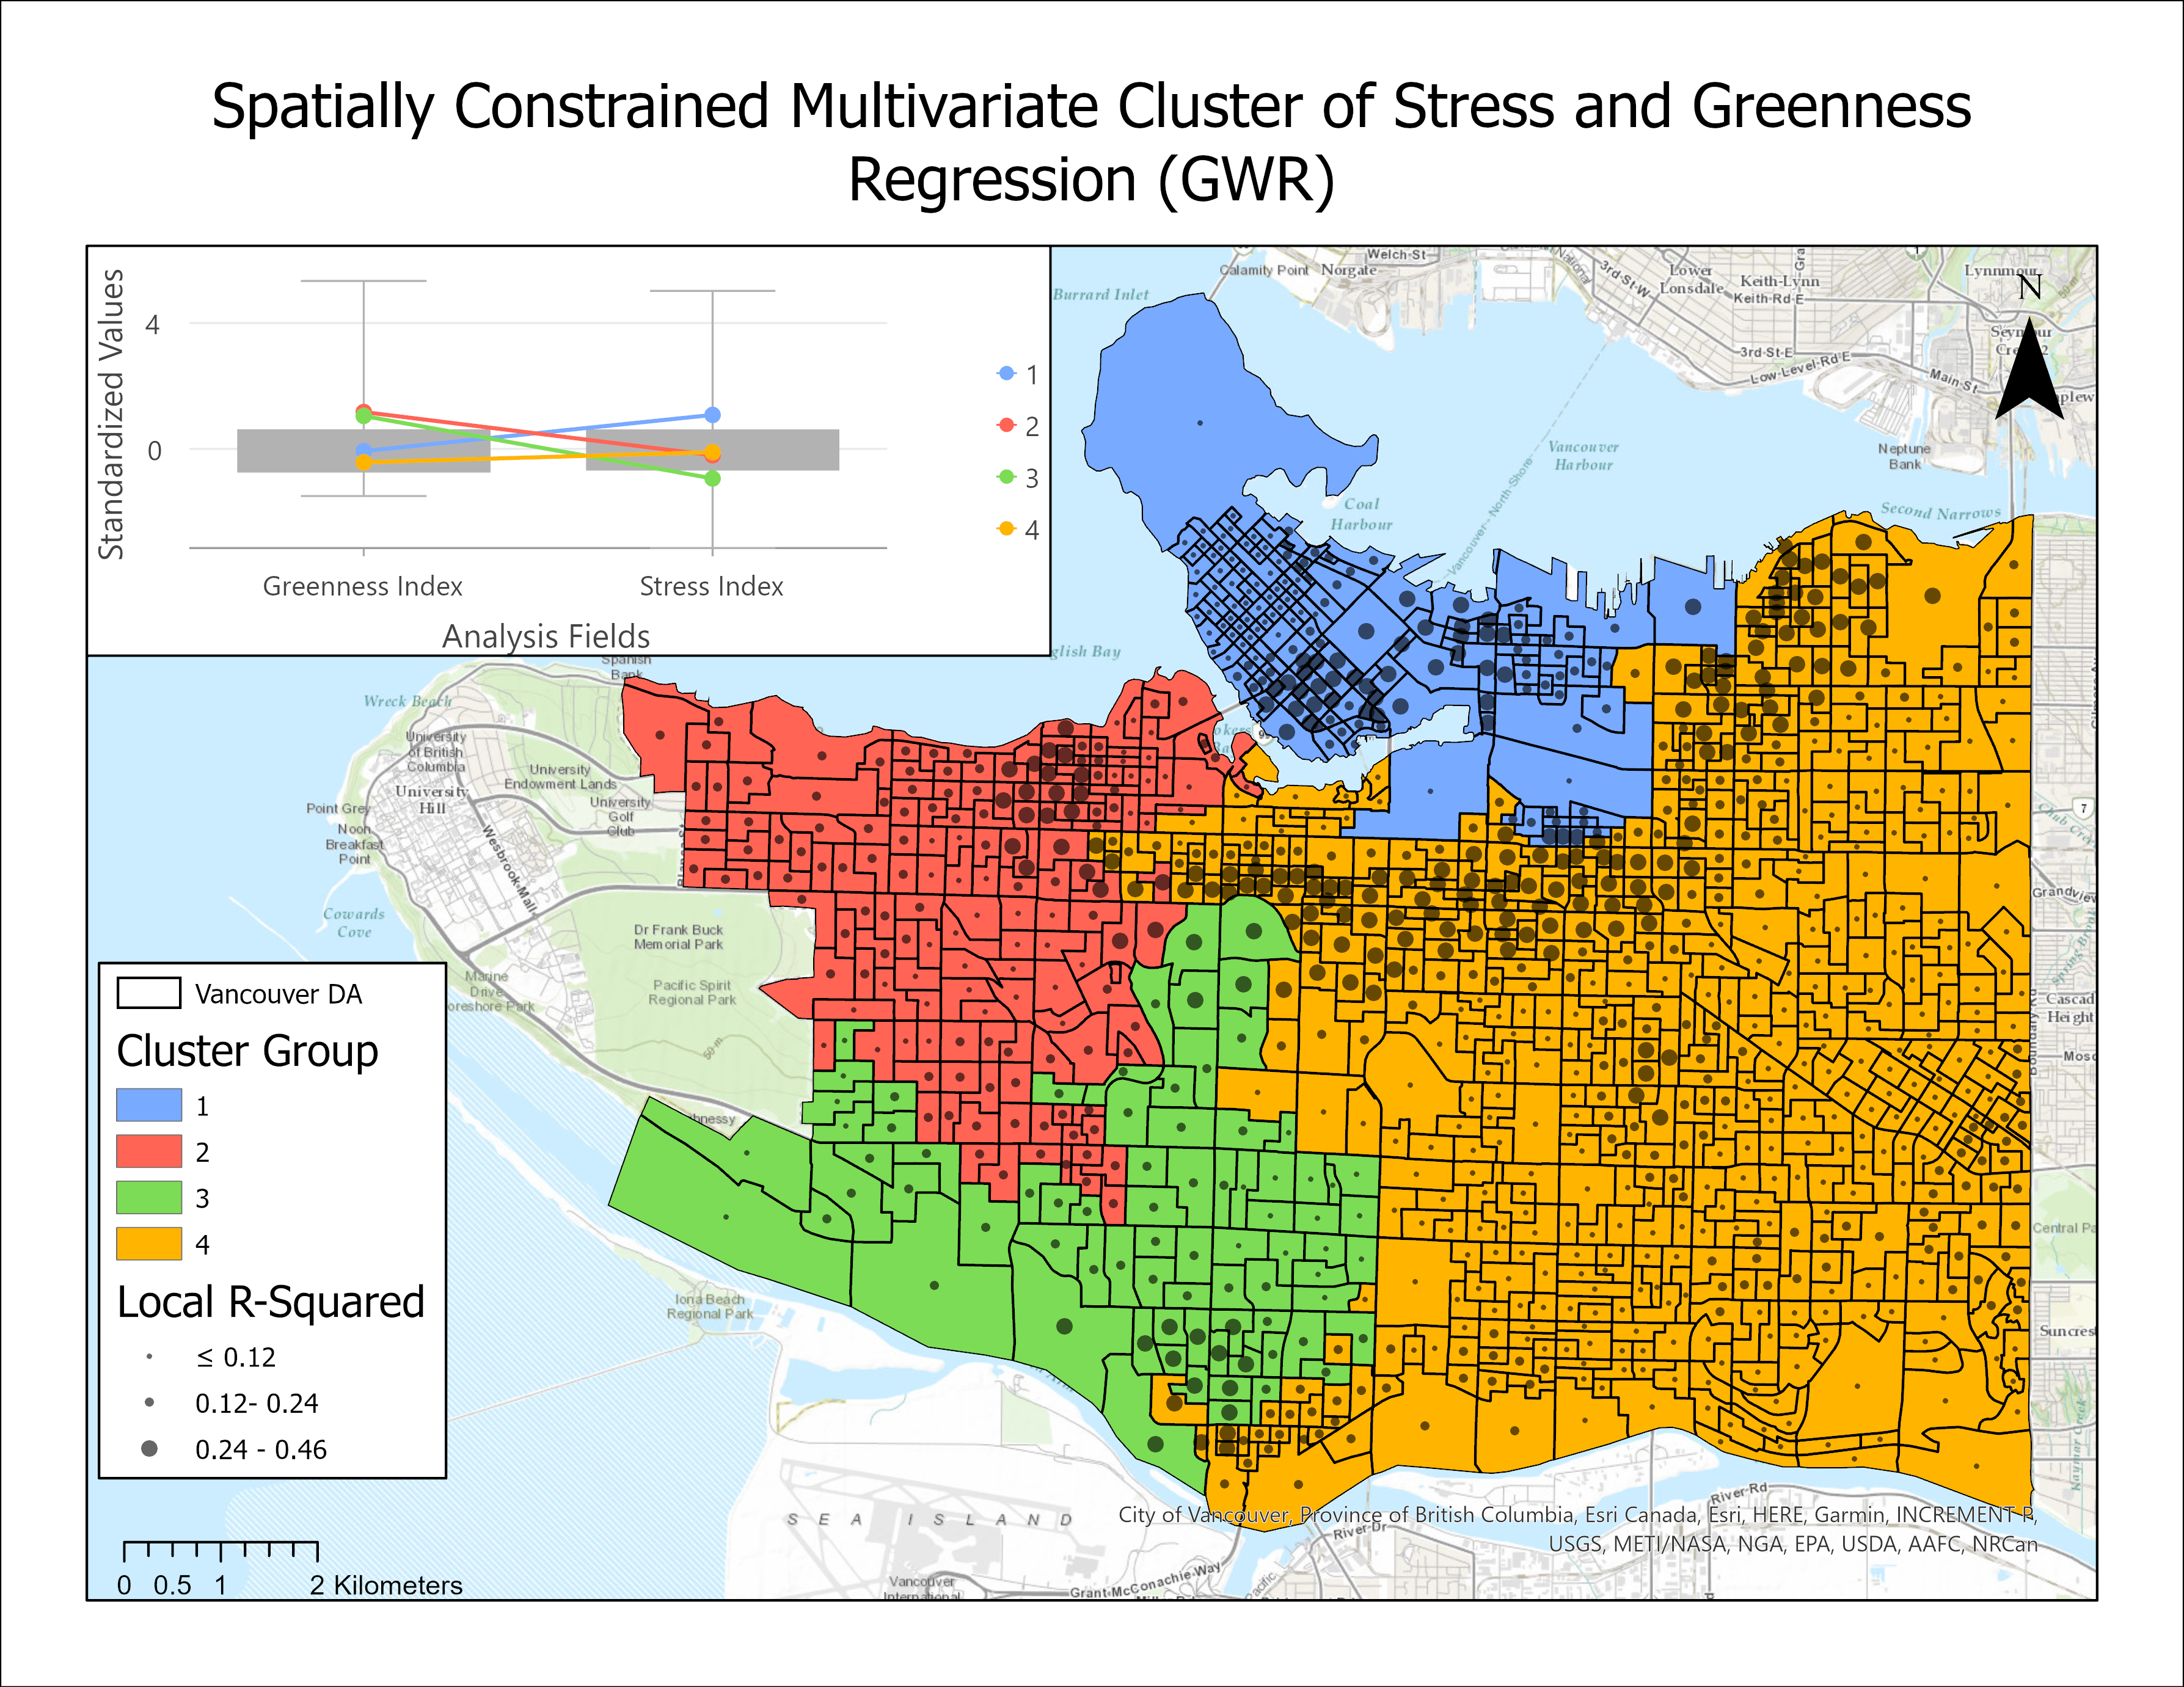
Figure 2: GWR Coefficient Surface
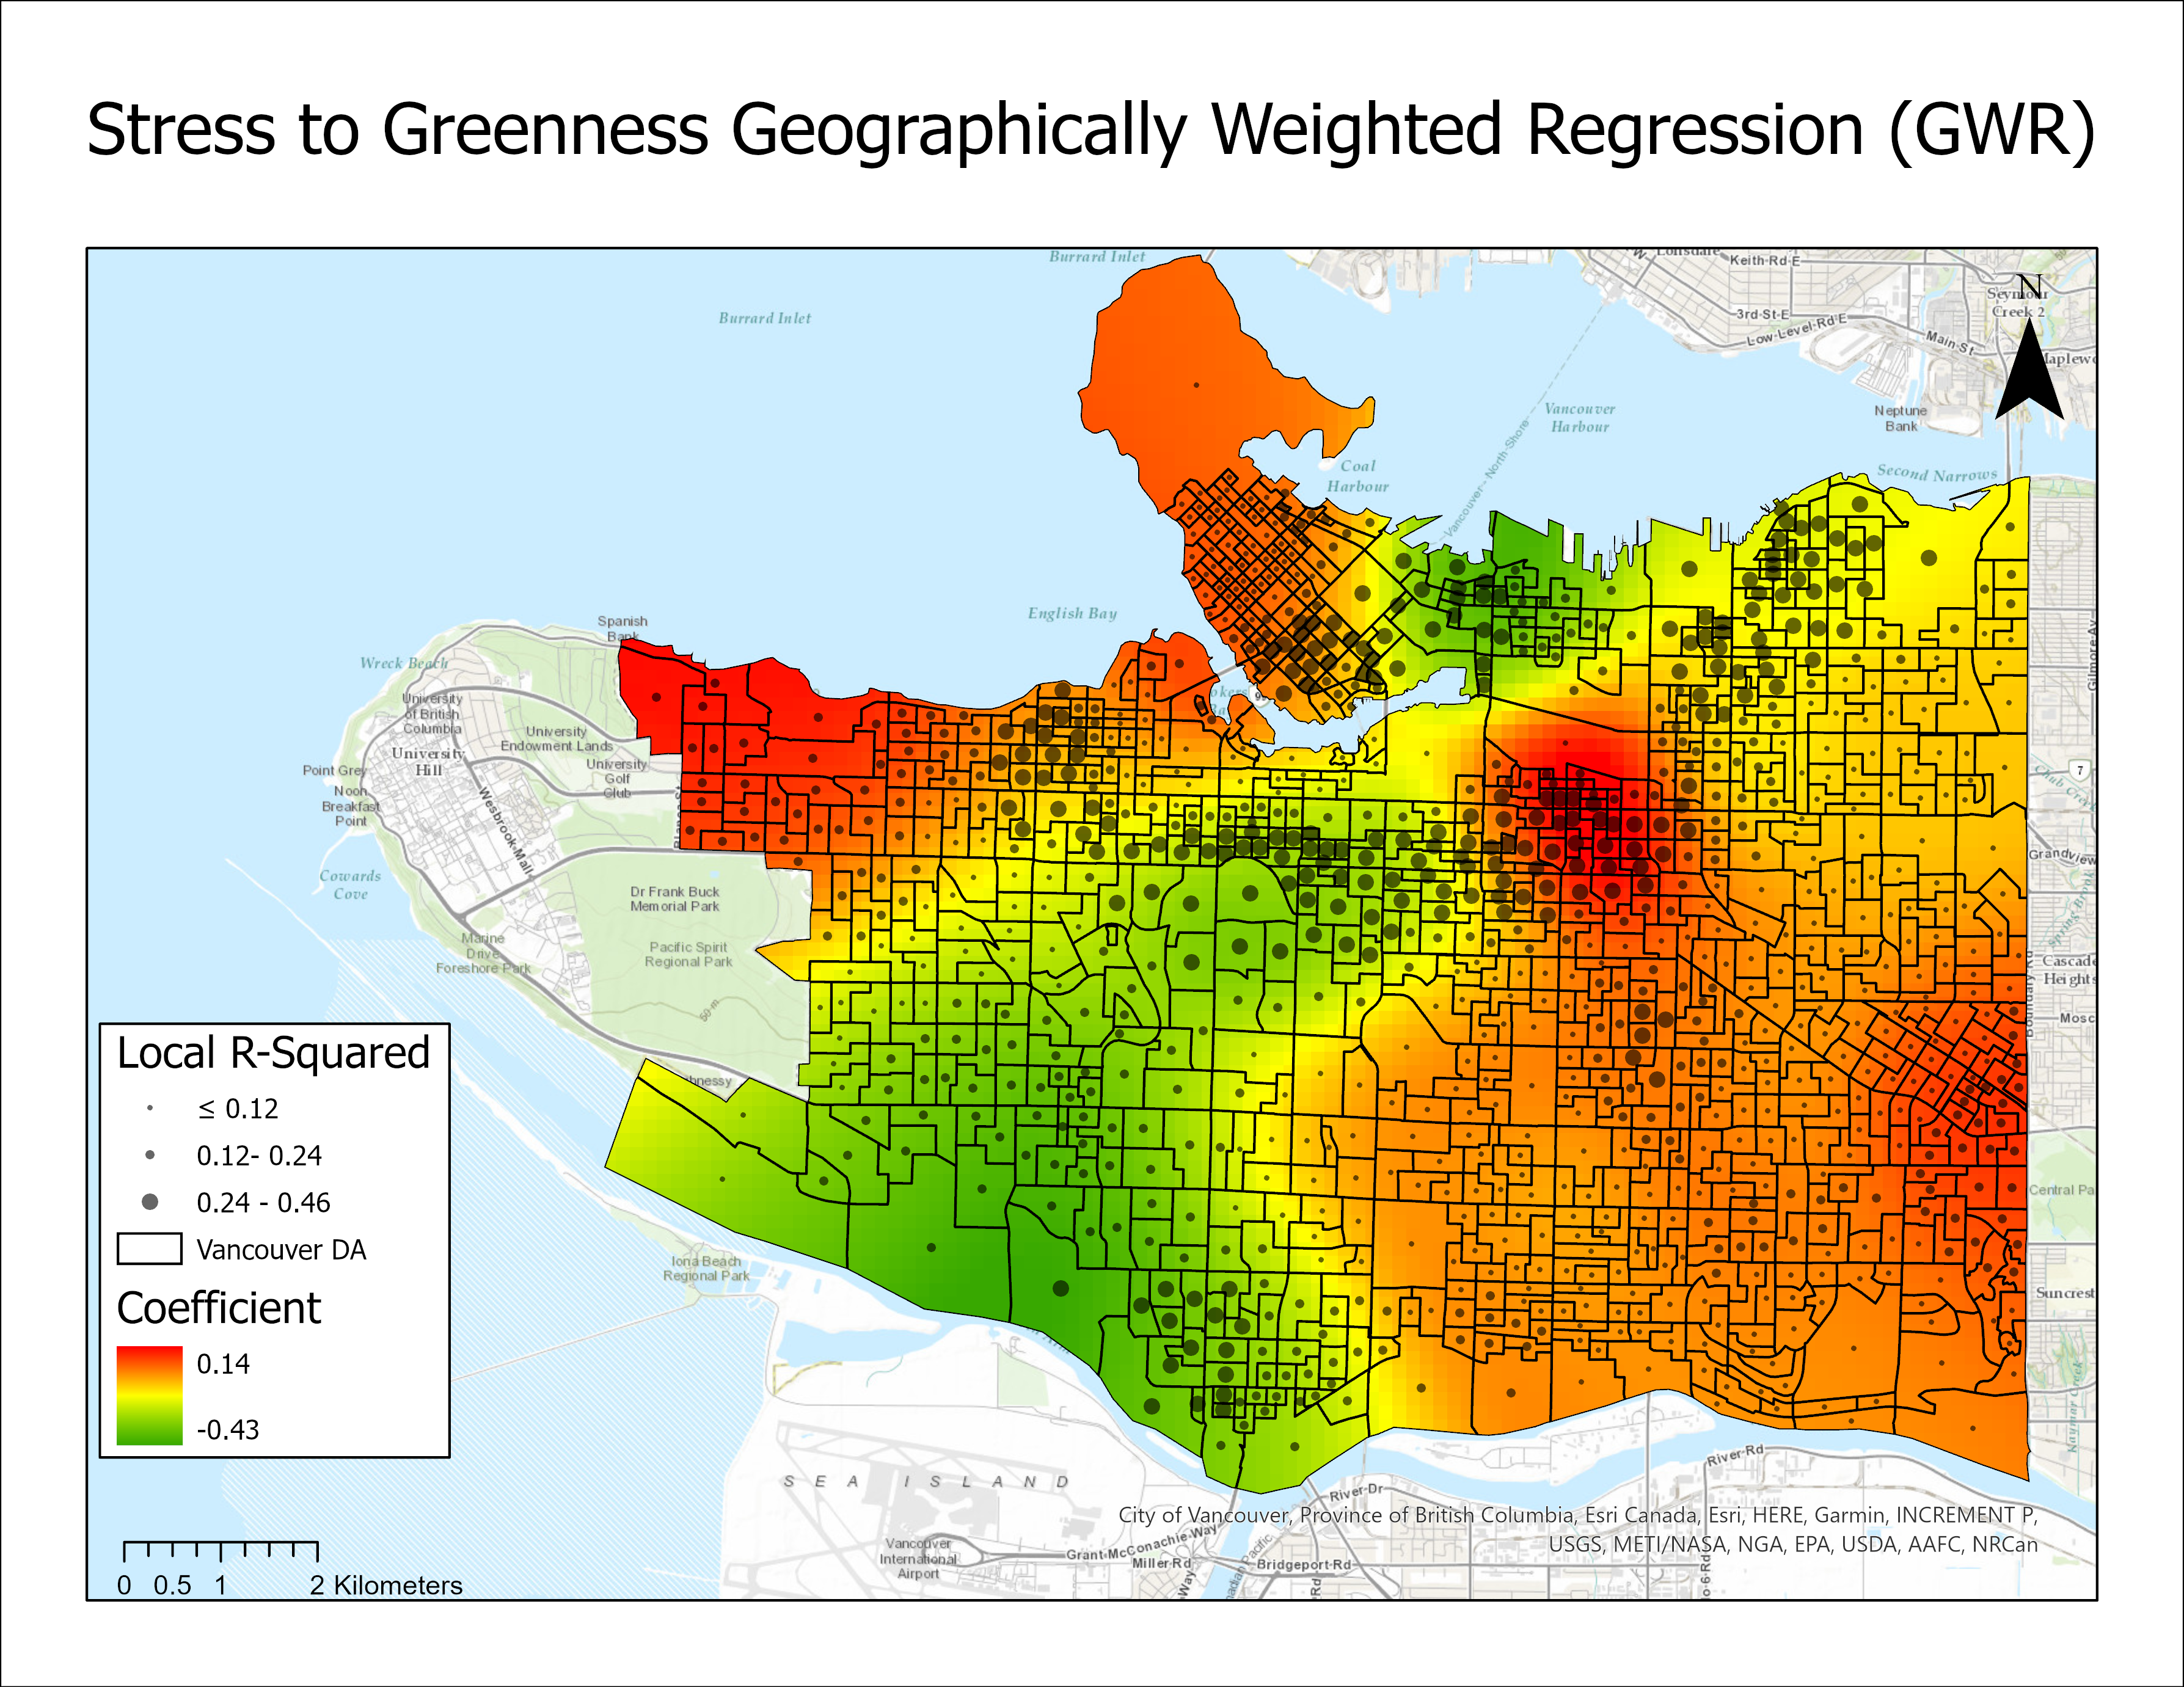
Figure 3: WGI and WSI Index Maps
Discussion:
The results from this study do show that there is some spatial correlation between the created indexes of stress and greenness. Although, the results are barely statistically significant. This analysis is a good stepping stone as a “proof of concept” for further analysis on the topic.
The biggest drawback of this study was the quality of data. As Statistics Canada does not release and standardized stress or mental health metric at the dissemination area scale, I had to settle upon using more indirect descriptors of stress as variables in my index. Additionally, the greenness index could be improved upon by using more factors. For example, using data on the frequency of used in urban parks, or whether or not people use them as outlets.
A notable potential expansion upon this analysis would be to use data from the previous Census year of 2020. The effects of the COVID 19 Pandemic on people’s mental health and stress levels from government mandated social distancing and lockdown measures is surely unprecedented. The extreme mental stress of the pandemic could potentially show and inflated correlation between mental health and access to urban greenspace, as parks saw increased usage throughout the pandemic.
With the proper access to suitable data, I believe this analysis could be improved to the point where, based on published studies as well as the statistical analysis of the GWR and SCMC, there would very significant results in the relationship between stress and urban greenspace in Vancouver. This theory could then be applied elsewhere as means to improve access as well as connectivity of urban greenspaces.