Individual Vessel Quota System in Norway

Throughout history, fishery has been an important pillar industry in Norway. Norway has been one of the world’s leading fishery country due to its geographical characteristics, a more than 83000 km coastline and moderate climate. In 2006, with catches of around 2.4 million tonnes, Norway was the 10th largest fisheries producer in the world. In 2009, Norway ranked eleventh in global capture fisheries production. Norway’s fishing and fish farming together account for 0.7 percent of the GDP in 2010 (FAO Fisheries and Aquaculture 2011)[i]. Cob and herring are the most important stocks in fishery industry in Norway along with sea and river fishing of salmon, and capelin.

Government intervention in fishery industry started early in Norway. In this blog, I will focus on one of the fishery policies in Norway known as the Individual Vessel Quota system (IVQ-system).

(1) What is IVQ-system and its implemented time, and specific limits?

In the last 1980s, there was a sudden and unexpected sharp decline of the Norwegian Arctic cod stock resulting in a most severe crisis in Norwegian fisheries in modern times. In response to the situation, first, the total quota was reduced significantly, from 630 000 tons in previous year to 340 000 tones. Besides, in 1989, the coastal fisheries were closed for almost the whole year (closed after only three and a half months). Then, in the fall of 1989, the Individual Vessel Quotas system (IVQ-system) was established and implemented for the 1990 season in the costal fleet (Fisheries Policy Reform: National Experiences 2011)[ii].

“IVQ-system is a management mechanism to distribute the Norwegian total allowable catch (TAC) amongst different segments of the fishing fleet. The fleet is divided into several groups according to size and fishing technique (trawlers, purse seine, etc). Each vessel group is then allocated a group quota which is then shared among the participating vessels in fixed and (more or less) guaranteed portions.”

–Fisheries Policy Reform: National Experiences 2011.

Therefore, IVQ-system’s geographic and biological reach would be consistent with that of Norwegian TAC.

Due to the special geographical location of Norway, most of its commercial fishery stocks are shared with other countries. IVQ-system is the quota for each vessel group (TAC divided by vessel groups), so it is implemented when the TAC is settled through international negotiations (mainly between Russia and other European countries). Important species included in TAC and IVQ-system are cod, haddock, salthe, herring, capelin, and so on (OECD Review of Fisheries 2011)[iii]. The specific limitation of different species are shown in the table below.

Table 1TACs and national quotas in 2008-09 for some important species

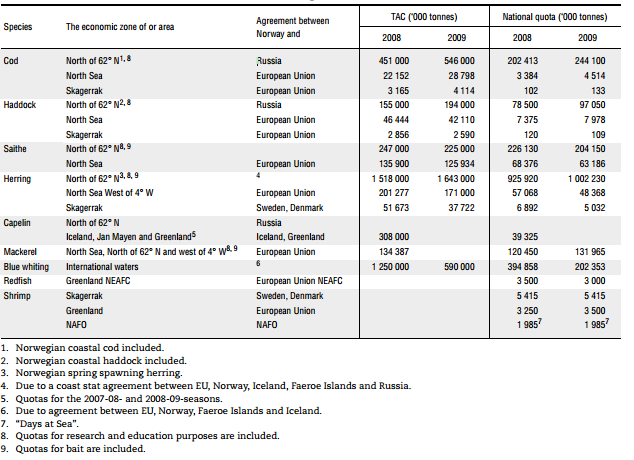
       Resource: OECD (2012), “Norway: Norway”, in OECD Review of Fisheries 2011: Policies and Summary Statistics.

According to the regulation, trade in quota is not allowed in IVQ-system, although there is an informal market.

(2) Enforcement mechanism

The IVQ-system was a two-tiered system. The vessels or fishermen were divided into two groups, the most active vessels and the less active vessels, according to the quantity of cod landed in the years from 1987 to 1989. For the most active vessels (the priority group I vessels), the quotas were exclusive, it means the vessel owner had the decision-making power to decide when or where to fish under the quota requirements. For the less active vessels (group II vessels), they were allowed to fish under a group quota, this implies the fishery activities would be more competitive. There were no restrictions for fishermen to participate to this fishery group, as long as they fulfilled the obligation and requirements of being a registered fisher. The difference of quota levels between two groups was relatively large, the quota allocated to group II was only about 10% of that allocated to group I.


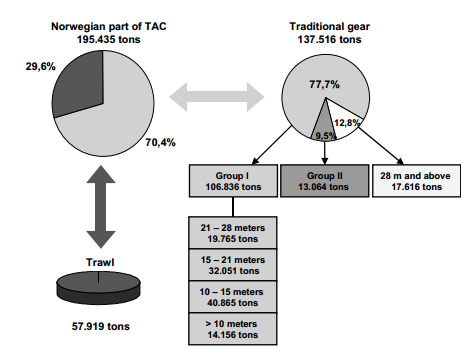
Figure 1Northeast Atlantic Cod. Distribution of National Quota 2002

           Resource: Country Note on National Fishery Management System – Norway

As shown in the figure above, the Norwegian part of the TAC is divided into quotas for each vessel group. Then each group quota is shared between vessels within the group according to the size of the vessels (OECD Environmental Performance Reviews: Norway, 2011)[iv]. There are three stages of the quota system: the negotiated national quota – the group quotas – IVQ-system.

(3) Potential advantages and disadvantages

The initiatives of the IVQ-system was to deal with the resource (cod stocks) crisis and supposed to be abolished once the situation returned to normal. However the IVQ system has become permanent. After the crisis, the main goal of the IVQ-system has been linked to two main pillars: one is the secure a decentralized ownership and the other one is to avoid unprofitable overcapacity as means to provide an economic viable fleet (Standal and Aarset, 2008)[v]. A major advantage of IVQ-system compared to the ordinary individual transferable quota system is that IVQ-system integrates quotas and vessels and is a bundled system. The IVQ-system has led to a huge concentration of quota ownership and severe changes in fleet structure.

However, there are some arguments about the disadvantages of this quota system. Some argues that political decision system cannot provides the most efficient allocation of a society’s resources, which is a common argument on the government intervention. Others argue that the system did not consider the vessels’ poor economy and the potential for changes in ownership, and Norwegian management regime seems to be the very suited for the strongest actors rather than some small companies in rural fishing-dependent areas (OECD Environmental Performance Reviews: Norway, 2011). These concerns may lead to the opposite side of the original goal of IVQ-system.

Together with other quota policies, the Norwegian fishing industry has changed from a heavily subsidized and capital highly concentrated industry to a relatively competitive one. Based on the results of-IVQ system, the government intervention has leave the duty of adjusting the capacity to those competitive power in the industry, which means it could secure high profit for who has the available resources to improve fishing technology. However, to be an efficient management instruments, IVQ-system requires improvement and adjustment, such as introduction of tradable quota which could encourage the fishermen’s per


[i] FAO Fisheries & Aquaculture – Fishery and Aquaculture Country Profiles – The Kingdom of Norway (2011). http://www.fao.org/fishery/facp/NOR/en#pageSection2

[ii] OECD (2011), “Introducing market-based reforms to manage overcapacity in Norway”, in Fisheries Policy Reform: National Experiences, OECD Publishing. http://dx.doi.org/10.1787/9789264096813-5-en

[iii] OECD (2012), “Norway: Norway”, in OECD Review of Fisheries 2011: Policies and Summary Statistics, OECD Publishing. http://dx.doi.org/10.1787/rev_fish-2011-33-en

[iv] OECD (2011), “Nature and Biodiversity”, in OECD Environmental Performance Reviews: Norway 2011, OECD Publishing. http://dx.doi.org/10.1787/9789264098473-10-en

[v] Dag Standal, Bernt Aarset. (2008). The IVQ regime in Norway: A stable alternative to an ITQ regime? Marine Policy, 663-668.


Sweden, home of the carbon tax

Sweden could be one of the most attractive place for environmentalists. In 2007, Sweden made its mark on a list that did the most to save the planet. From year 1990 to 2006, the carbon emission in Sweden decreased significantly by 9%, while the Kyoto Protocol allowed for a 4% increase in emissions. At the meantime, Sweden still enjoyed economic growth of 44% in fixed price[1]. All this remarkable success has not happened on its own, one of the main reason is the introduction a carbon tax in 1991.

What is a carbon tax?

Carbon tax is a form of pollution tax. It is usually defined as a tax based on greenhouse gas emissions generated from burning fuels[2]. The government sets a price per ton on carbon, then translates it into a tax on electricity, natural gas or oil[3]. Since there is a price added on carbon emission, the price of electricity, natural gas or oil will, therefore, increase. It sends out a massage to the market that to reduce the conventional energy consumption. Under the affect a carbon tax, industries, business and individuals tend to pursue clean alternative energies and increase energy efficiency.

However, a main problem with a carbon tax is that by raising the price of energy it disproportionately impacts the poor. In the case of Sweden, introducing a carbon tax actually stimulated its economic growth. Since 2010, Switzerland has led the ranking as the most competitive economy in the world according to the Global Competitiveness Report 2010-2014, but it does not mean that there is no impact on the poor. We will discuss this later.

Snapshot of carbon tax in Sweden

  • The origin of the carbon tax: Sweden enacted the carbon tax with the reformed of energy tax system in 1991.
  • The goal is to discourage oil use.
  • How it works: The tax is levied as a specific tax on oil, coal, natural gas, bottled gas, and petrol.

Which fuels are covered and which fuels are exempted?

As a complement to the energy taxes system in 1991, the carbon tax is a general level tax. The major taxed sectors are natural gas, gasoline, coal, light and heavy fuel oil, liquefied petroleum gas, and home heating oil[4].

The tax is not levied for biofuels, and peat is also exempt from taxation (Folke Bohlin, 1998). For energy intensive industries, like electricity production, no tax is applied but non-industrial consumers have to pay a tax on electricity consumption. Additionally, no tax applied on 50% of the general level on fuels used in industry (Bengt Johansson, 2000).

How does the policy implement over time?

The tax was initially set at a general level of UUS $133 per ton carbon. But since it put a heavy loan on industries that relied on natural gas, coal and oil (a double total tax for natural gas, 80% increase in total tax for coal and around 20% increase in total tax for oil), the tax rate was amended in 1993 considering the competitiveness of industry. After the emendation, industry, agriculture, forestry, and fisheries paid only about 21% of the tax and this remains the same today. Besides, these sectors can receive additional reductions (and refunds) depending on the company’s value of sales versus their tax payment. In year 2009, the standard tax rate was $104.83/metric ton CO2 while the tax rate for industry was largely lower at $23.04/metric ton CO2.

Potential negative distribution effects

“In 2011, for example, Swedish households faced the highest prices for natural gas which was 4.2 times more expensive than the cheapest gas prices in Europe – in Romania. Furthermore, nearly half the cost of natural gas in Sweden – 44.3 percent – was due to taxes and levies in 2011.” (James Burgess of Oilprice.com)

Distribution problem is reported as a primary issue on the carbon taxes application. The poor would suffer more because a larger proportion of their available income has to be paid for daily energy usage than their wealthier counterparts. In 1995, energy and environmental taxes generated a total national revenue of US $6 billion or 3% of the gross national product[5]. If the fiscal revenues collected from the carbon tax would be recycled to support R&D projects or just return some amount to the poor, some of the regressive impacts may be offset.

Is it a cost-effective tax policy?

Cost-effectiveness means that using the lowest cost to achieve a set target. Therefore, we need to know the degree to which carbon tax has achieved its goal as well as the cost.

As mentioned before, the goal of this carbon tax is to discourage oil use and hence decreasing the carbon emission. The result was very satisfying – by 2003, oil accounted for only 32% of Sweden’s energy, and Sweden is now pursue to become the first completely oil-free economy in the world by 2020[6].

The distributional implications discussed above is one part of the social cost of the carbon tax policy, competitiveness impacts could be another social cost.

Competitiveness implies the ability of an economic entity to sell its products and services in domestic and global market. Take a company as an example, if the company emit CO2, a carbon tax will affect the cost structure and increase expense, thus loss its price advantages. The emendation of tax rate in 1993 in Sweden was a result of such concerns.

Another cost would be generated from a standard level of tax rate in different sectors throughout Sweden. This can result in some sectors do not operate in their most efficient way. In conventional economics, a tax policy would be cost-effective when the tax rate equals a company’s marginal abatement cost. However, it is very difficult for the government to know all the detailed information in all sectors. If the tax rate is higher for some industries, they need to pay higher than they should, but if the tax rate is lower for some high carbon emitting industries, they are required to pay less than they should and it may lead to more pollution as the tax is too low.

Policy makers prefer a carbon tax for its simplicity but it could be costly as well. So government of Sweden need to be thorough to keep their success of the carbon tax policy.


[1] http://www.theguardian.com/environment/2008/apr/29/climatechange.carbonemissions

[2] http://www.government.se/sb/d/16022/a/190032

[3] http://www.fin.gov.bc.ca/tbs/tp/climate/A1.htm

[4] http://www.oecd.org/sti/inno/2108273.pdf

[5] http://www.economicinstruments.com/index.php/component/zine/article/78

[6] http://theenergycollective.com/znesheiwat/208421/swedens-quest-be-first-oil-free-nation

Bohlin Folke. (1998). The Swedish Carbon Dioxide Tax: Effects on Biofuel Use and Carbon Dioxide Emissions. Biomass and Bioenergy, 283-291.

Johansson Bengt. (2000). The Carbon Tax in Sweden. Development for Economic Co-operation and Organisation, Innovation and the environment (pp. 85-94). France: Organisation for Economic Co-operation and Development.

The Last Week

Happy or Sad 

I’ve experienced emotional ups and downs over last six weeks, what a interesting memory! At first, I thought this blog thing would be terribly difficult for me to complete, but as time goes by, I found it is a great stage to show our different ideas and colorful life. Besides, I’ve got confidence from this experience because you, my dear classmates, all pay a lot of patience reading blogs (endured my poor writing skills) and encourage me to write more detailed or academic ideas about trading. Thank you!

Here, one graph includes all my feelings during the game and we even witnessed a historical event in the U.S. history! (Click it to see details!)

I mainly focused on three commodities: CORN, WHEAT and SOYBEAN. It turned out that without the theory I was gambling in the first few weeks and we only have six weeks in total! Kinda upset. Bad foundation made it really hard to turn my performance around.

Hey, do you like Plants vs Zombies? (Some critical thinking about the technical analysis)

Last year, every one in China especially teens was crazy about Plants vs Zombies. I found it is quite similar to our trading game. So I created this, do you wanna play?

It is a game requires strategies and in the survival mode it need players to change their arrangement of plants according to the different kinds of zombies. Quite alike our trade game, right?

The way you arrange the plants is more like the way you trade using technical analysis. First, you should know the features of different plants, in trade game, it is called technique methods, in order to find the best suitable arrangement. Second, zombies in different kinds and numbers come randomly, like the changes in futures market. Weather, natural disasters, demand and supply situations all will result in the fluctuations in price, which is difficult to predict.

Good players are always rich in their experience in the game. You can find the best way to perform after playing the same scenario many times. But it is different in the real-world trading game. In fact, I treat technical analysis as a summary of historical performance of the market data. As we learnt in 585, there is no guarantee for any forecasting method to be accurate in the future since they all based on the historical data.

So when I always found one technical analysis actually works after the fact have happened already. There is a serious lag between theory and reality. This also explains that why we are often unsure about our strategy and afraid of being wrong. At last, it usually turn out that we are regret about “I should have done this!”

The only way I can think of to overcome this uncertain feel is to trade a lot and aggregate the experience as much as possible, that is to say, get familiar with different kinds of market performance. It needs time.

Could I say this again? “Good luck with trading next week!”

P.S. the most important thing I learnt from this great game is always be positive. Attitudes can change things!


Enjoy the weekend!

Mia


WEEK 5

WEEK 5

Keep the day trading simple and think like a mouse

I believe this week, every one in our class work really hard to figure out the futures price & spot price and the trend of price if there is a sudden big shock in demand and supply situation. As for me, it took me a lot of time to get familiar with Mr. Theory, as a result, I could only call Mr. Practice this morning.

Just for Fun

So what can we do if we only have the opportunity for day trading? I am thinking in this way: if you are just starting day trading, then focus on keeping the trading plan simple and don’t think about each trade as the greatest potential trade of the century. You are a mouse looking for crumbs on a daily basis. What is it they say? An elephant gets mighty big eating peanuts. Swing traders are seated at the banquet table. Day traders are mice. So let’s keep this analogy at the forefront of us one day traders’ trading mind.

Strategy: Hedging

I took the long positions of Wheat December and short positions of Soybean March (but I chose the wrong futures to short, explain later).

Wheat December 2013

Previous trend: There was a Head & Shoulder pattern in the red rectangle, which implied that there would be a big increase after the second shoulder. The fact confirmed this implication and after a relatively lower lever on Wednesday, the price for December Wheat increased from around $6.84 to $6.96 early this morning. Then there was a stable increasing trend as showed between two red lines.

What I predict: I believe the increasing trend will continue for several days so I took 5 long positions when the price was relatively stable at $7.02. Notice the rising rate is high today.

Soybean March 2014

The reason why I said I chose the wrong futures is that the price of March Soybean should be increase afterwards.

Between the two red lines, there is a typical pattern that implies a ascending trend – Top flat, bottom rising. So the spread between this pair of futures would be smaller. But as mentioned before, the increasing rate of wheat is really high and that of soybean is relatively lower, therefore, there is a potential opportunity to gain profit based of price spread trading. But, in case of loss, I will watch the trend carefully.

A useful method to predict the future trend – Elliott Wave Theory

I knew this theory in the Technical Analysis Of The Financial Markets by John Murphy, I am impressed by its ability to predict where a market will head next. The Elliott wave looks like this:

Elliott proposes, as well, that all price moves on the market are divided into (one circle):

  • five waves in the direction of the main trend (waves 1 to 5);
  • three corrective waves (waves a,b,c ).

The waves are divided into:

  • impulses that create a directed trend (bull or bear) and cause the market to move very actively (waves 1, 3, 5, a, c);
  • corrections (rollbacks) that are characterized by moving against the trend (waves 2, 4, b).

 Applied in predicting the market:

It took me some time to find a typical Elliott wave in the real market, which could be a weakness of this method. Market changes all the time and is not consistent with any typical patterns.

As we can see from the above diagram, there are two circles during the period. These two circles are absolutely consistent with Elliott wave, which includes five waves in the direction of the main trend and three corrective waves. Suppose you are in the fifth wave of one circle, then you can predict that the price will go up in the future, but be careful with the seventh wave that is falling.

The red circle and blue circle show two opposite directed trend, but the principle is the same, just remember the direction between two adjacent wave will be opposite.

Mia’s Happy Time this week – Do you wanna eat like a trader in the Wall Street?

Being a foodaholic for many years, I am always trying to combine my favorite with our game since the first trading week. Since I cannot be a trader in the Wall Street right now, I decide to eat like them!

I saw a video on Bloomberg.com when tried to find interesting stuff related to trading.

For breakfast, traders like to eat breakfast pizzas topped with eggs, cheese, bacon

and sausage.

One Wall Street pizza joint says it gets orders for as many as 15 breakfast pies every Friday from the boys at Nomura, a Japanese brokerage giant that has vast offices in New York.

For lunch, it’s on to burgers. Traders at Goldman Sachs like burgers with hand-cut fries at the Hideaway, a neighborhood bar in Tribeca, Bloomberg reports.


Dinner is practically a stereotype on a plate, with Smith & Wollensky serving traders ribeye and lamb chops with lobster on the side.


Well, it seems that eating like a trader in Wall Street is not that healthy. But, it looks good…

Have a great weekend! Enjoy the food!

Mia

Keep learning and be excited!

“Could I be classified as assignments, or project will be better, instead of just a game?”

– Mr. Futures

I guess only a few of us traded frequently this week (since the trades made is almost the same as last week).

As you may notice, there were more discussion about the assignments, projects,video things, case study and midterm…while much much less comments on trading. This phenomenon implied that we are all dedicated people (said this in BBC news style), cheers!

It seems that we are “enjoying” a short vacation in futures market like U.S. government do in the real world.

So, this week I’d like to share:

  • Quick news review
  • A whole new way to trade
  • Review of my portfolio

Quick news review

 Be careful with wheat.

Australia’s newly started wheat harvest appears, in its early stages, to be echoing the world trend, with Australian Crop Forecasters hiking its forecast for wheat tonnage, but highlighting disappointment on protein levels.

The wheat production turns out to be higher than the forecast in Australia lifted by some 2.5m tonnes to 25.9m tonnes. This figure was above estimates from the US Department of Agriculture, at 25.5m tonnes, and the International Grains Council, at 25.0m tonnes.

Go sugar, go!

Sugar prices hit their highest in nearly seven months after cane industry officials revealed a 23% tumble in output of the sweetener from Brazil’s key Centre South region, thanks to rains which are continuing to undermine output. It is reported that the drop in sugar production in the last half of September was even larger than that in cane, falling 23% to 2.29m tonnes, as mills diverted more crop to making ethanol rather than the sweetener.

Really good harvest in corn and soybeans.

Corn yields in two major US growing states have come in “at or near record levels, the harvest upgraded by 225m bushels to 13.7bn bushels. The forecast for the soybean yield was also raised, by 0.7 bushels per acre to 41.1 bushels per acre, and the harvest was upgraded by 44m bushels t 3.6bn bushels.

Spreads – a whole new way to trade

We got very good resource about futures trade this week, or let’s say finally we know things about the technical analysis, thanks to Andrew and Mark. I even felt excited after Thursday’s 501 class cause we now have some theory knowledge supporting us to choose a better strategy.

This time, I will go into the Future Spread Trading.

I knew this concept from Laura’s blog and it really attracted me. It introduce a new idea about trading futures – it offers us the opportunity to profit off contract spreads instead of just taking a position on the market’s direction.

When we are trading a spread, we are trading two correlated markets at the same time. It could be intracommodity spread like to long December corn and short July corn or could be intercommodity spread, example can be long March corn and short July wheat. So the main idea here is going LONG in one market and SHORT in another market.

One great thing about trading spreads is that we can take advantage of seasonal supply and demand changes in agriculture commodities and the position has limited exposure to external market forces like natural disasters, international incidents or US gov shutdown. Also, a big advantage here is it can help us to catch the right trade timing.

 I figured out an example to help us understand the strategy:

Let’s say I have two contracts for corn: September at $6.50/bushel and November for $5.50/bushel. Assume that in your opening position, I’ve bought (long) 100 bushels from the September contract, and sold (short) 100 bushels of the November contract. The spread is now $1.00. Assume that the September contract goes up to $6.90 while the November contract goes up to $5.60. The spread is now $1.30. So I could sell the spread position (short the September contract and long the November contract) and make $0.30 per bushel. In other words, I’ve made a net gain of $40 from buying and then selling the September contracts, while I’ve made a net loss lost $10 from selling and then buying the November contracts. Thus, the net profit would be $30 altogether.

How to use apply this strategy in to our trade game?

Let’s take sugar #11 as an example (I was planning to trade sugar futures last week, but you know….). Anyway, I’d love to show some preparing work here.

There are two red arrows in the graph above which shows the increasing rates of both March, 2014 Sugar futures and May, 2014 Sugar futures. We can see that between Oct 3rd and 4th, the arrow in March Sugar is much more flat than that in May Sugar, so the spread between these two period will be large and it will be a good time to short March Sugar and long the May Sugar at the same time. Here is the spread graph of SBH14 and SBK14, it shows the same result that we concluded from above graph.

So, we can make a good profit by short March Sugar and long May Sugar simultaneously on Oct 3rd and then buy March Sugar and sell May Sugar on late Oct 3rd. It seems that I missed a great opportunity to make money last week. Well, I think the spread will be more obvious when two correlated futures have different changing trend.

In a word, the point I want to make here is to focus on the relationship between two positions you have and estimate the changing rates of two positions then set the spread order.

Quick review of my portfolio

Basically, my portfolio behaved quite stable last week and the portfolio return kept negative as I only held one futures – wheat. It seems that it is really difficult to earn money with only one futures even the price is rising. Hope we have more time to focus on interesting trade game next week…


Good luck with assignments, project, case study, midterm AND trade game next week.

Enjoy the Thanksgiving Day and this beautiful Autumn!


Mia

A rainy week for trading

The federal government shutdown, leaving traders and food producers in the dark

In this week’s blog, the first thing that I want to share with you is the big news: the federal government shutdown. In many ways it could affect the whole world, but the most significant influence on us could be showed clearly via this picture:


As the shutdown of the U.S. government enters its third day, it seems that we are going to miss the October crop report. The monthly crop estimates released by USDA often cause swings worth billions of dollars in the price of corn, soybeans, wheat and cotton. It is reported that U.S. livestock markets are reeling from this week’s disruption of data from the U.S. Department of Agriculture as the federal government shutdown drags on, while grain traders are muddling through without a key report on weekly export sales.

http://www.reuters.com/article/2013/10/03/us-usa-fiscal-agriculture-idUSBRE99212H2013100

Review of week 3

What happened 1: There was a huge decrease on corn and soybean at the beginning of week 3. On October 2nd, corn fell 0.46 percent to $4.37 a bushel and soybeans fell 0.28 percent to $12.64. It implied that corn and soybeans remained under pressure from USDA reports released at midday on Monday stating that supplies of the crops were much larger than analysis anticipated. The U.S. corn harvest advanced to 12% complete this week while soybean harvest progress reached 11%, USDA said. Also, USDA reported on Tuesday that exporters had sold 113,000 tonnes of U.S. soybeans to China.

It is said that a record-large corn crop and the fourth largest soybean crop on record pressured corn prices to the a three-year low and soybeans to a 19-month low.


Interestingly, most trade for corn and soybean happened simultaneously and the volume was also quite similar. It implied that people tend to trade during the fluctuation of the price. In my opinion, it is easier to earn some money or cover the loss while the trade volume is at a level sine the price is more unstable and we can buy and sell or short and cover in a very short period.

So, I did this: I gave myself a big relief when I finally sold all of my corn futures and soybean futures on Tuesday. And then, I waited for three days hoping the price of soybean could rise a little so that I can short some soybean futures. But it seems that the price of soybean was already too low to gain money from short positions.

What happened 2: Unlike the sad mood that soybean and corn usually bring to me, I like wheat futures best since by far it is still helping me earn some money from this changing market. Wheat futures is still undergoing the affect of bad expectation on lower output in Argentina, which led its neighbor Brazil to ramp up wheat purchases from the U.S. Brazil’s wheat crop was also damaged by frost. Additionally, top wheat grower China increased imports of U.S. wheat to stem a domestic shortfall.


As you can tell from this graph, the price of wheat futures soared as high as $6.98 –  the highest level since June 21.

So, I did this: Being a typical risk-averse person, I am worried about the price would going down after hitting the highest point. So unfortunately, I sold 6 unit when the price was fluctuating on Wednesday. Then the remaining 9 units bought me $10,537.5 profit but my portfolio return is now -2.96% since I don’t hold that much futures like week 2.

 Lessons for week 3: 

  • Don’t be regret after ordering. I mean regret cannot change anything except your mood, so think carefully when placing the order. I learnt this because of the low price I sold corn and soybean at. I was planning to sell them on week 2 but there was a little hope that they would rise a little bit. But this week….Just forget it, because I stop bleeding for them.
  • Keep calm when the price is fluctuating. A big lesson for this week is that I lost my opportunity profit as I sold almost half of the wheat futures just because it went down a bit. In other words, I don’t believe my research. Try to get used to the fluctuation in future market since it happens all the time.
  • Be positive about trading. Well, it seems like a rainy week for trading as all the crop price is going down except wheat. Some is earning a lot while some is losing. I found myself start being afraid of the changing price and always worried about money. That is not good for trading I guess cause that would hold you from trying. So be brave, girl!

As for next week, I would wait for the increase of corn and soybean and short them and get ready for wheat once it starts falling. Try some new things like sugar and coffee, I did trade any this week because I am doing the research and observing the price trend.

Anyway, like the shine outside today, good luck for next week!

Mia


Trade Early and Trade Often

  • “U.S. wheat eyes biggest weekly gain in 14-months”

— let’s buy some wheat!

During the first week of our great trading game, I was totally comfortable with sitting at the bottom of the raking list with my poor -12.83% portfolio return, admiring friends make loans of money at +12.83% portfolio return…

This week I logged in my account in the same mood and suddenly something big happened – there are some numbers in green waving to me. Immediately, I thanked God and tried to seize the hope that finally appeared in my trading life.

As we all known by far, the price of wheat soaring into the sky this week, buoyed by expectations of strong demand from China (my lovely mother land) and Brazil. This huge increase leads my portfolio value to rise from $87,167.44 to $104,909.93.

  • “Conservative angel VS. Adventurous devil”

 Buy more wheat and try to sell some corn and soybean

 I can’t wait to share some transactions I did during the second week.

Firstly, motivated by the increasing tendency, I bought 9 units of wheat future and ended up with totally 15 units, which bring me $16,350 profit. I didn’t buy it as soon as I found the price is rising, instead I waited for small decreasing moment and then held some long positions (sorry for doing this during class, BTW once you are in the future market, it’s really hard to move your eyes from the big broad).

Secondly, I shorted and covered some soybean oil (about 1 or 2 unit) as some one in my mind told me I should try new things. It was kind of funny as I pretend to a professional speculator who buy low and sell high all the day. But it didn’t work well because of my patience. Anyway, good try.

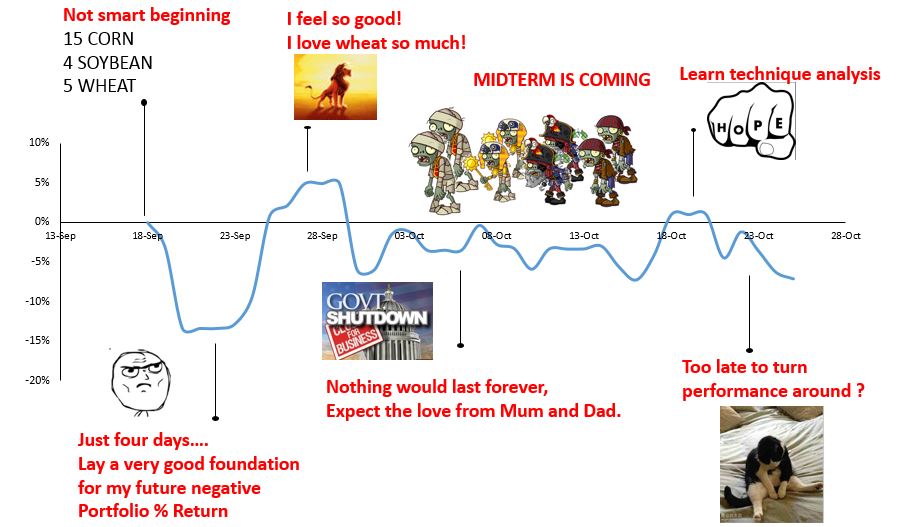
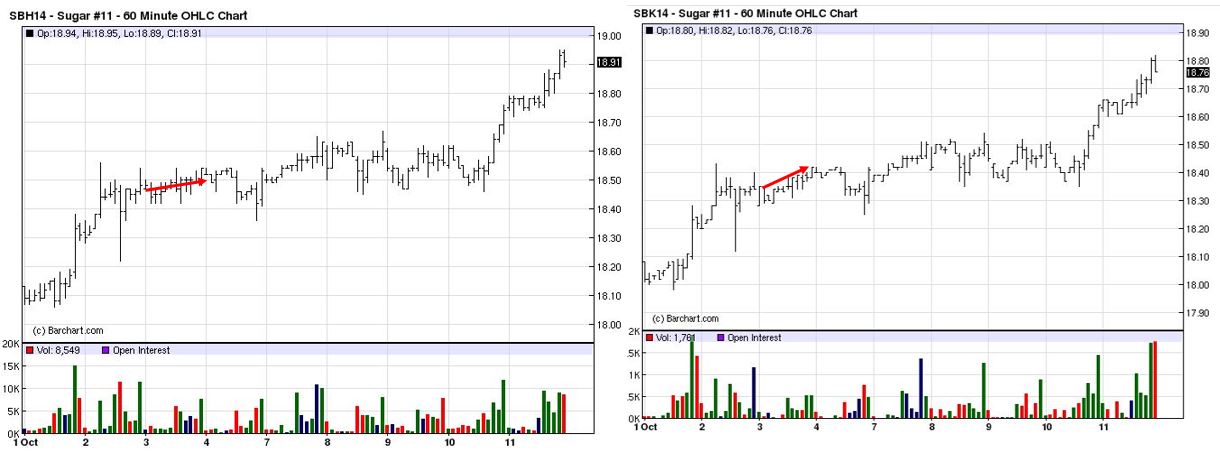
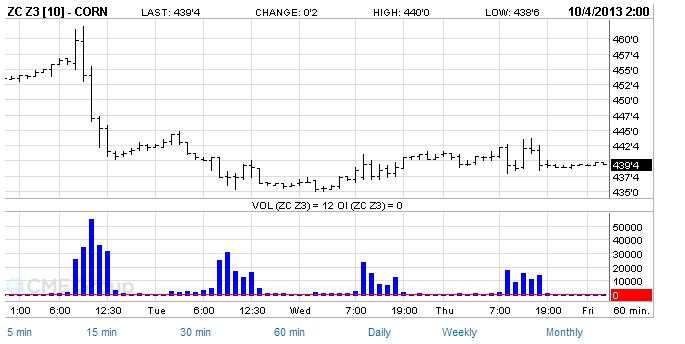
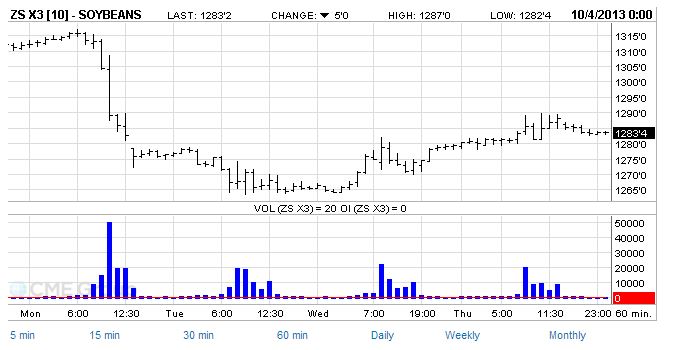
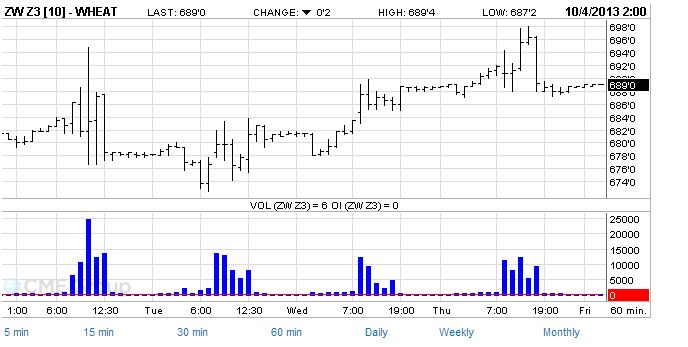
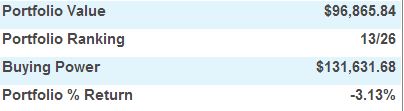
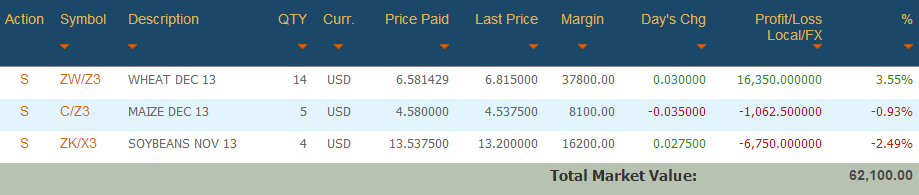
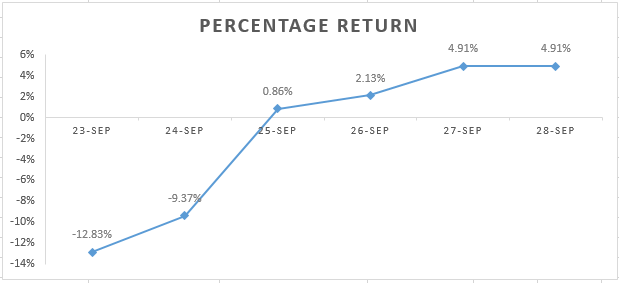
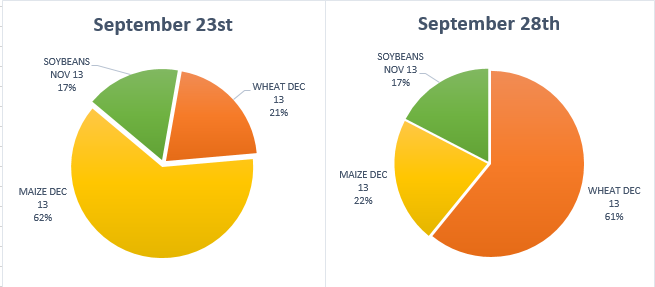
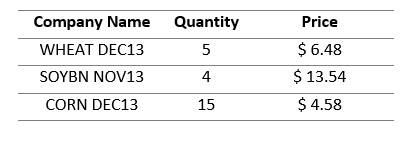
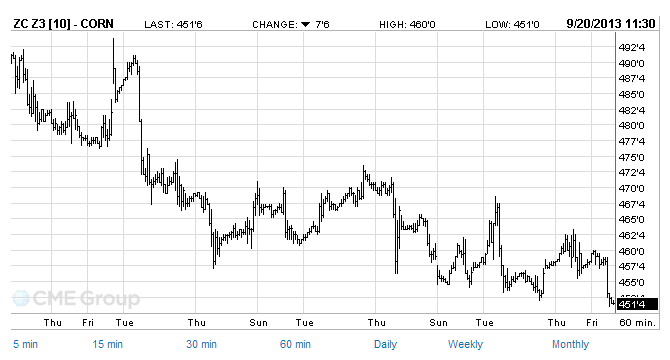
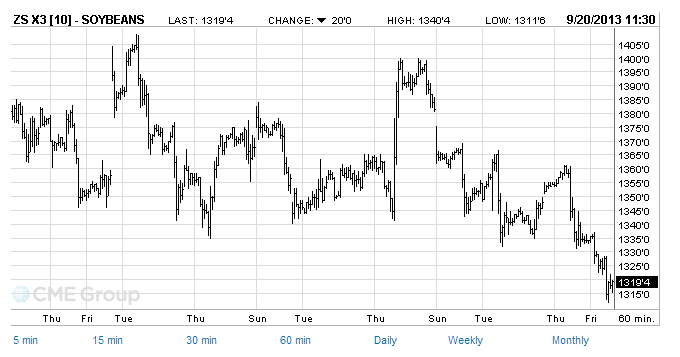
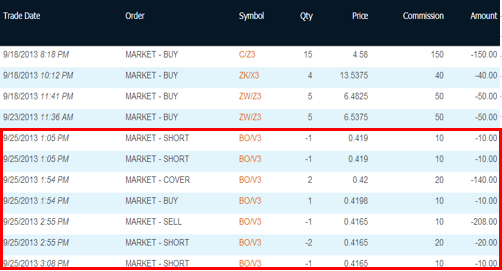
Thirdly,  I tried hard to stop bleeding because of the decrease in soybean (always) and corn. As staying with a negative portfolio return for a long time, I realized it would be a long time to go back to the original price. So I decided to lose a little money instead of much.  As there was a slightly increase of the prices. I sold them in two times, each time I sold half and set different market limit prices, for example 2 units at $4.5 and another 2 units at $4.53. As a result, I reduced my huge lost.

 Lesson 1: Don’t make any decision as you see the price is going up. You can never be too patient to trade futures. Don’t hurry and spend some time to figure out what is the real trend of the market price.

Lesson 2: It’s OK to try something new but it’s highly that do some research first, to know what is it and what’s the main factors that will affect the price.

Lesson 3: Set a strict base line for the amount of lost. Once the lost is more that, you sell it no matter the price since it would cost you more in the future. The base line could be -5% of return and according to my experience -10% would be the maximum.

  • News highlight “weather” & Signals for the coming week

News for this week mainly focus on the weather also it’s the main reason for huge increase in wheat market. But for how long would this trend last when the USDA releases the next crop report on Sept. 30th? I doubt it.

“Argentine worries” – It’s reported that there would be frost and droughts in Argentina, the southern hemisphere’s second-ranked supplier. This unfavorable weather conditions supposed to slow wheat seeding and affect the whole market.

Chinese signal” – China’s domestic wheat prices have reached record levels, ending at 2858 yuan a tonne on Friday because of the droughts at  the central and eastern regions of China. As the world’s biggest wheat consumer, China may increase imports to boost stockpiles and help curb record gains in local price, Shanghai JC intelligence Co. said.

“Abundant Soybeans” – the U.S. Midwest is forecast to remain mostly dry in the next three day, according to World Ag Weather. Drier weather this week will favor harvests, so it seems that to short soybean would be a good choice for this coming harvest season. Let’s wait for the crop report from USDA.

As for next week, I will do some research about soybean oil and try to take some right actions on it. Further more, I think it would be helpful to pay close attention to the crop report released by USDA since it would say a lot about demand and supply situations of the world. As for wheat, I think it may not keep the increasing trend like this week for too long, so I would also keep an eye on it. The most important thing is to read news every morning and trade after you have some ideas about the market. Trade early and trade often!


Mia


Changeful Price in Future Market


What did I bought

Really inspired by the suggestion that “make as many mistakes as you can:, I just closed my eyes and jumped into the future market.

The first trade was made on Sept. 18. After watching some guide videos on Youtube and with help from classmates and Google, I bought corn, wheat and soy beans just based upon personal interest.

Unfortunately, it seems that my choices are not so good, with the portfolio return at -13.96%. Surprisingly, the  portfolio return of major class turned out to be negative when I opened computer this morning, but still, mine is the lowest (sorry about my poor trading skills), it makes me so curious about what happened in the market.

Here I’d like to keep track of my adventure in Stocktark

My first trade

Top 3 mistakes I made this trading week.

  • With no ideas about the future market
  • Don’t understand why and how commodity prices move higher or lower
  • Did not figure out what percentage of money should spend on futures

In a word, I started buying and selling with no specific market strategy. But now I am getting to know the market.

Unlike stocks or other futures, the agricultural commodity futures are more sensitive to the harvest season and demand-supply situations. Take corn as an example, corn crops around the world have their own unique production cycles of planting and harvest time-frames. Generally speaking, corn is planted in the spring and harvested in the fall. While the supply expectations often shift significantly due to weather and growing conditions in growing season, the winter months usually deal with demand and supply of the harvested crop. So it turns out that the summer months is when most of the action in corn prices take place, however, corn futures can be fairly subdued during the winter months.

So I realized that awareness of seasonal trade would be helpful when buy or sell agricultural commodities. Since the northern hemisphere is waiting for the beautiful winter, we may need to pay more attention to the demand and supply situations of the whole market.

Here, I’d like to share some resource we can access to the demand and supply situations in US.

  • Prospective plantings – the main report at the beginning of the crop growing season from USDA. It is released around the end of March since 1964 and summarizes how much and which crops the farmers expect to plant for the upcoming season.
  •  Monthly Crop Production – Released around the 10th of each month. The report gives an update estimate of supply and demand for crop.
  • Grain Stocks – Provides information on the current supply of corn and other grains in the US and the world.

The big news in agricultural futures this month

Interestingly, the price curves of corn, soybean and wheat all experienced a huge but different change on last Friday.

The changes are instant responses to the big news released on Spet. 12 – the USDA raised its outlook for the domestic harvest and projected US farmers to harvest 13.843 billion of corn this year, which exceeds the forecast made in August and would be the highest number ever. Also private analytic firm Informa Economics raised its forecast of US 2013 corn and soybean production, estimated the 2013 corn crop at 13.889 billion bushels, which above the USDA’s forest for 13.843 billion bushels.

The new domestic harvest data from USDA implies that there would be a good corn production this year and plenty of corn are available. As a result, corn futures for December delivery drop 1.7 percent to around $4.514 a bushel in CBOT, heading for a third straight weekly drop. The falling wedge may not necessarily be an ending pattern. Therefore, it seems it is not a good time to buy too many units of corn future.

Likely, the soybean dropped most in week but the trend is more likely because of the weather. It is reported that field from North Dakota to Ohio (key growing area) got as much as 2.5 cm of rain last week. Rainfall may aid some immature crops filling pods with beans. The USDA said on Sept. 12 that the global production of oil seeds including soybeans, canola and sunflower seeds will rise 4.8% this year. Abundant supply makes the soybean future for delivery in November fell 1.5% to close at $13.2 a bushel on CBOT after touching the lowest point around $13.12 since Aug.29.

Take a little break

After the first trade, all I wanna say is that  it’s so wise to trade with fake money.

The price of future is changing all the time and there are so many factors, such as policy, harvest season, storage, imports and exports, demand and supply etc., can lead to big increase or decrease of the price. I think it would definitely take me some time to understand why commodity prices move up and down.

For next step, I will keep an eye on my soybean futures since it is the chief culprit of the lost and then to have a better understanding about how to choose short position and long position. Still many things to learn and more practice is necessary.


Mia