Part of the GEOB 270 learning process, we conducted a spatial visualization of Metro Vancouver by their median propety values and median incomes in each households.
Goal: Determining Vancouver’s housing Affordability through measuring the ratio of median house price to median income.
My task is to:
1) Develope a spatial map of Metro-Vancouver by Census Boundaries
2) Spatial join Housing Datas from using (CHASS data centre) provided by University of Tonronto
3) Conduct analysis using tools of Arcmap (Classification, Spatial Join, Select by Attribute).
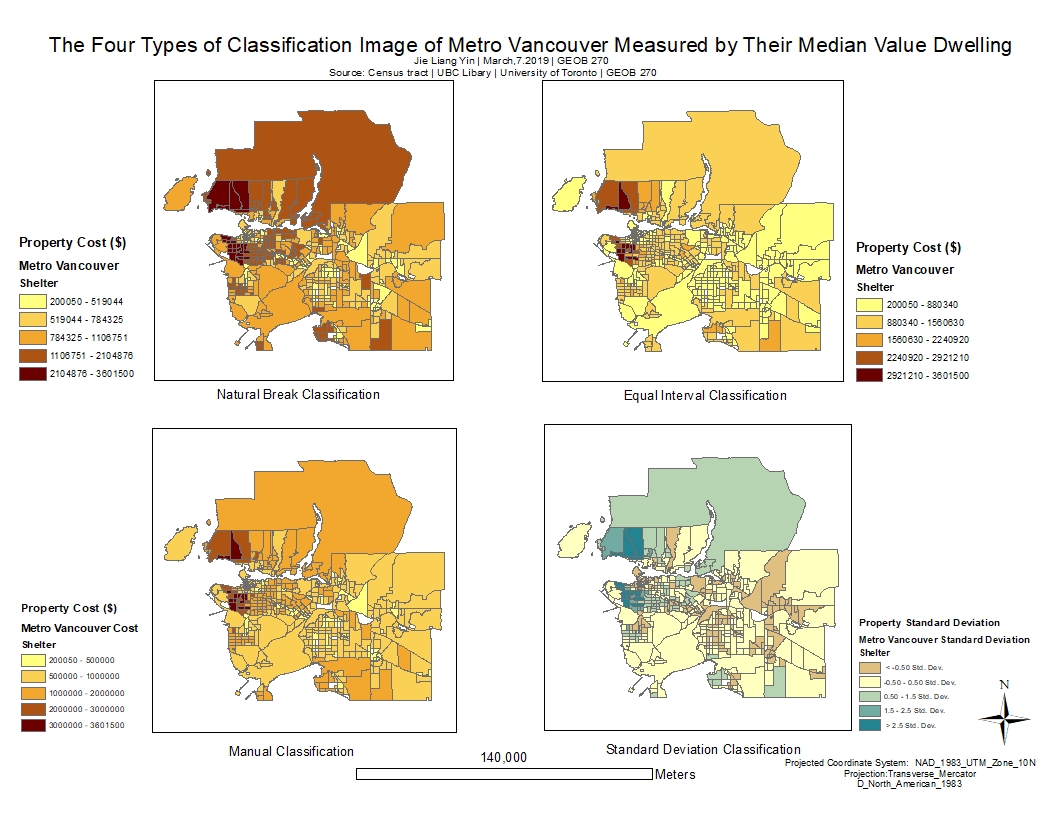
Figure 1. The Four Classification Methods Used to Display Vancouver Housing Prices from Data’s of 2016.
- Quantitive Data Findings:
I have presented four types of classification to display the visuals of property prices in Vancouver. One of the first thing to notice is that despite the data is consistent throughout the maps, but different method of classification can influence the interpretation on maps. For an example, the breaks between property price is an influence because it ultimately decides the amount of quantity that would be shown within an interval. The relationship between Equal interval and Manual Classification is that Equal interval is a classification method done by computer by seperating number of data into equal intervals. In this case, housing prices have been distributed into five classes with an equal range of cost, similar to an arithmetic sequence. On the other hand, Manual breaks can be classified by people because there are specifc data interval that have meaning in their chosen numbers. I would use manual break to specifically emphasize on something such as housing price that are above $70,000 and below $140,000 that reflect average housing price in Vancouver including Condos. Nautral break is classified by the computer by noticing a difference in the data sets by finding similar value and group them; in order to maximize difference. The last is standard deviation classification which shows how far the values are from the mean.
2. What are the uncertainity when making classification?
In case Census Tracts attribute has a record of zero for median income or housing prices. It is typically normal because we found 4.1% of our total census tracts that has no value in the median value of dwelling cateogory. The CT generally cover population ranging from 2500 to 8000 people. The minimum requirement is that CT should it homegenous as possible in socioecononmic characteric. On the other hand DT is a much smaller area with population from 400-700 people to look at more in depth visuals.
3. Cost of shelter Findings
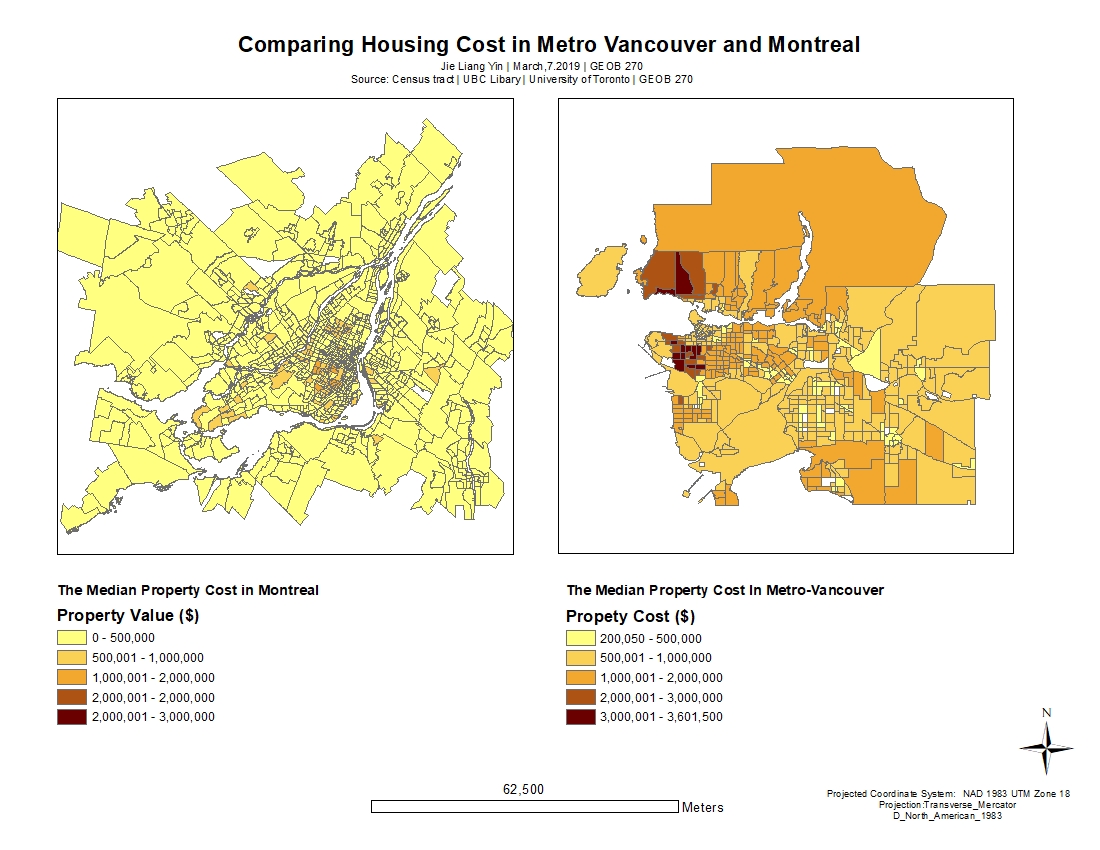
In Figure 2. The map is represent by the shelter values assigned to a specific boundary using Census Tract. The data included are the median value of dwelling divided using Census Boundaries. The data can be extract from University of Toronto (CHASS), but this representation only show the median value of property cost. It does not cover the average cost of housing prices, instead the median cover a value that is in the middle between sets of data. In this case, because there is a lot of outliers so propety may be influenced by high propety cost in those areas. The problem is that it may not reflect the exact value of a typical price you might see in those area; the lack of information cannot be used for further mathematical calculation.
Figure 2. The Comparison of propety cost between Vancouver and Montreal
Conclusion: I learned that it is possible to create affordability visualization by extracting data about income and property value. One of the knowledge to take home was I learned information can generally be converted into knowledge especially about a specific matter. When we look at the Demographic International Housing Affordability ( Cox,Pavletich 2019) We can generally see affor dability is a formula from median house price divided by gross annual median household income. In a sense, affordability is ranged into categories that larger income with smaller housing value will yield to a better degree on the table. The affordability survey is used on world-wide housing studies, and it contain high level of trust for contries that are based from analyzing trends in countries market.
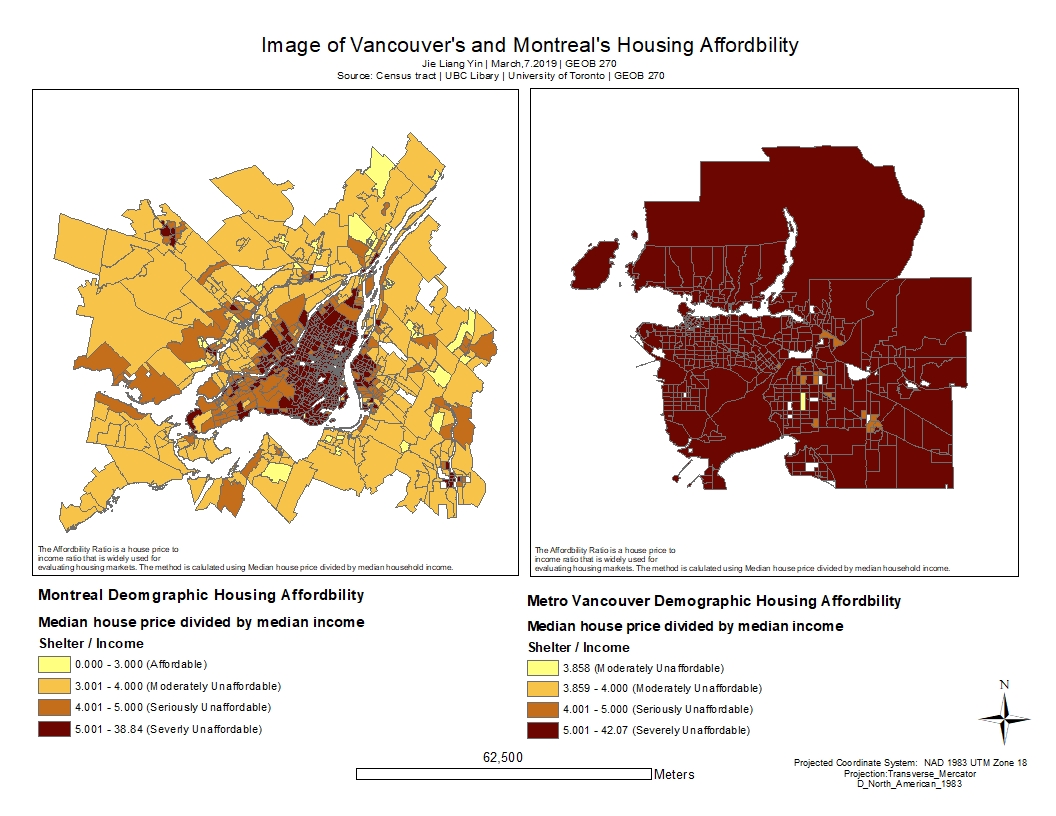
On Statistics Canada, it has mentioned places that are more vulnerable to property value increase are more likely to experience unaffordability. The objective of this survey is to promote audience on understanding the relationship of housing price and their income. I believe in Vancouver, most of the houseing are generally considered expensive and through visually it is recognized by the affordability index. If we applied different classification like housing cost even the visual is not going to be much different. Most houses in Vancouver is considered 5.0 or above. Despite changing the categories, most Vancouver housing fell above 5.0 due to a mathematical calculation but housing cost can be different as mentioned in Figure 1. The affordability indicator is more informative because housing price contains outliers to begin with. Affordability is very similar as an indicator to determine livability because it is the ability of access to resources in our environment. To begin with, housing is part of the indicator to measure the quality of life. It also includes financial resources, natural resources, human resources. Liveability is certainly a key charactertistic that attract people to live in certain areas, but higher affordability could influence certain aspect; because people would need to work harder to access the basic shelter and then develope further needs (Maslow’s hierarchy of needs).
Table 1. Housing Affordability measurement (Source: Demographic International Housing Affordability Survey)
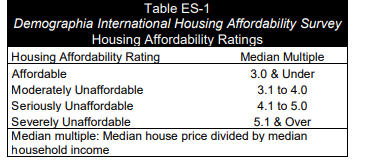
Figure 3. Housing Affordability comparison between Vancouver & Montreal from Census data of 2016.
My learning experience:
- Be able to extract and parse data from scratch learning to acquire data that are relevant to our purpose. The vancouver and montreal comparison can be visually emphasized using classification methods.
- Spatial joined tabular data of Canadian Census 2016 by obtaining income and housing cost from CHASS University of Toronto Database and highlight only regions of interest.
- Learn how to effectively use the four kinds of classification, and learn how CT/DA influence our data.