Selection of Climate Stations
The precipitation data analyzed in this project is collected from Environment Canada’s historical climate data. Environment Canada collects precipitation data, but the data collection failed to be monitored in the same time periods. To ensure that adequate data is acquired to demonstrate the relationship between winter precipitation events and elevation, the time series are divided into 2 groups: 2001 – 2010 and 2011 – 2020, and for each time period, climate stations located at different elevations are selected. The frequency of heavy storm events (i.e. 1- day precipitation > 40 mm and 3-day precipitation >100 mm) will be counted and compared. Although some climate stations are out of range from the Mosquito Creek Watershed boundaries, it can be assumed that the data are representative due to the close proximity of the station to the watershed (i.e., within five km distance).
Climate Station Information
| Elevation (m) | Station | Time Series |
| 4 | N VANCOUVER 2ND NARROWS | 2001 – 2010 |
| 7 | N VANCOUVER WHARVES | 2001 – 2010, 2010 – 2020 |
| 170 | WEST VANCOUVER AUT | 2001 – 2010, 2010 – 2020 |
| 183 | N VANC SONORA DR | 2001 – 2010 |
| 1103 | N VANC GROUSE MTN RESORT | 2001 – 2010, 2010 – 2020 |
Analysis Results
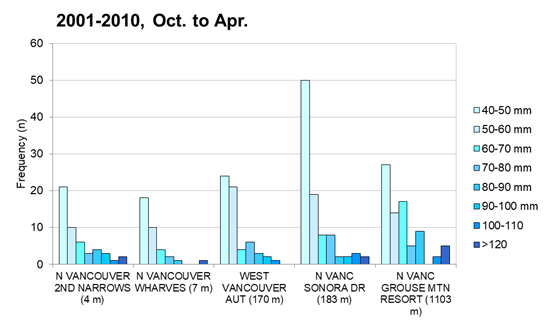
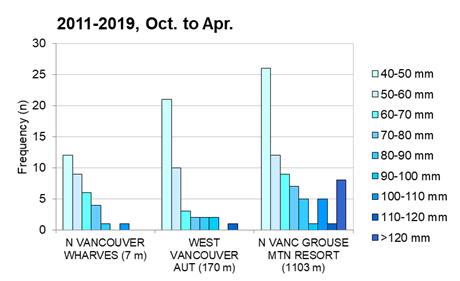
The graphs below compared the documented frequencies of 1-day precipitation events over 40 mm observed in winter (October to April) at climate stations within or in close proximity to the study watershed. Cumulative precipitation patterns exhibited clear differences for selected stations located at different elevations. In terms of magnitude, data retrieved from selected stations showed that accumulated precipitation increases with rises in elevation but the relationship is complicated. From the analysis of winter 1-day (24-hour) accumulated precipitation events, it is recommended that communities located between 0 – 200 m elevation should consider the cumulative impacts of 40 – 50 mm/day storms rather than big storms as management priorities to reduce the runoff volume, whereas higher elevation (e.g., Grouse Mtn Resort) would expect the high cumulative events (1-day total precipitation exceeding 100 mm or 3-day total precipitation exceeding 200 mm) for stormwater management. Among communities located below 200 m elevation, lower watershed communities in the City of North Vancouver (elevation < 80 m) are not expected to experience as frequent and heavy precipitation events as communities located at medium elevation and thus, LID infrastructure should be selected accordingly to be fully functional and cost-effective.