Land Use Map
The detailed land use information for the lower and middle watershed is determined with the reference of the 2011 Generalized Land Use Classification Map acquired from Metro Vancouver’s Open Data, which is based upon 2011 RapidEye 5m multi-spectral satellite imagery and full feature LiDAR data and thus precise for assessment.
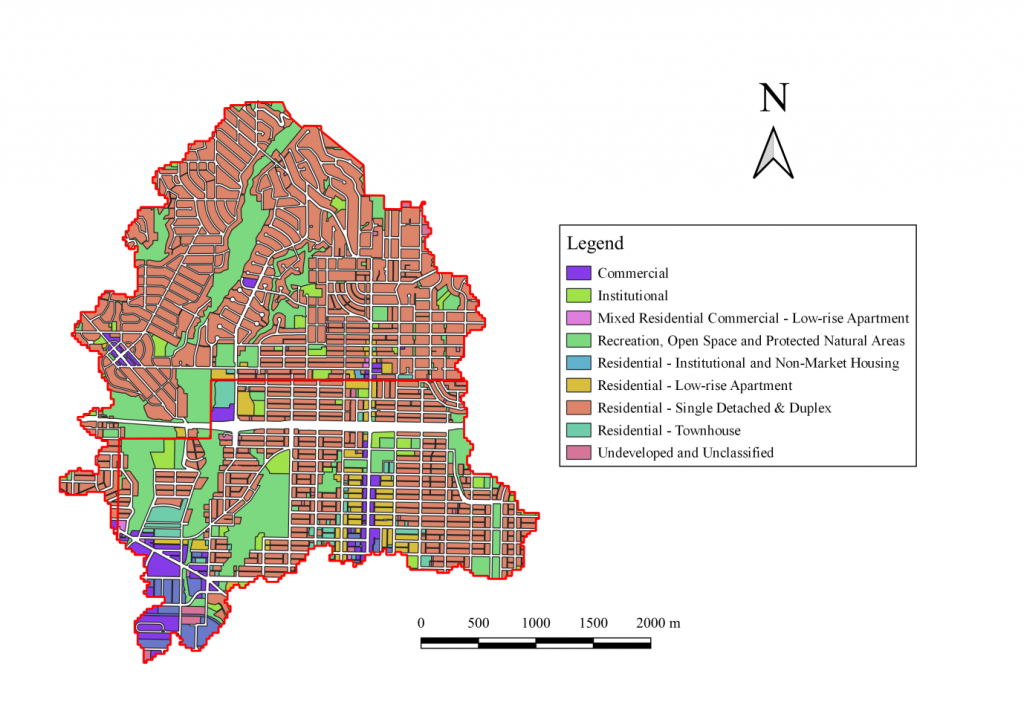
The dominant land use types in lower and middle watershed contain commercial, institutional, and residential areas. The single-detached houses and duplexes are predominant in both regions. The majority of commercial centers and apartments reside in the lower watershed that belongs to the municipality of CNV, whereas over 50% of townhouses are located in the middle watershed governed by the DNV. The 2011 land use mapping results suggest that the extent of urbanization in the lower watershed is moderately higher than the middle watershed, accompanied by structures with greater imperviousness percentage (e.g., commercial buildings).
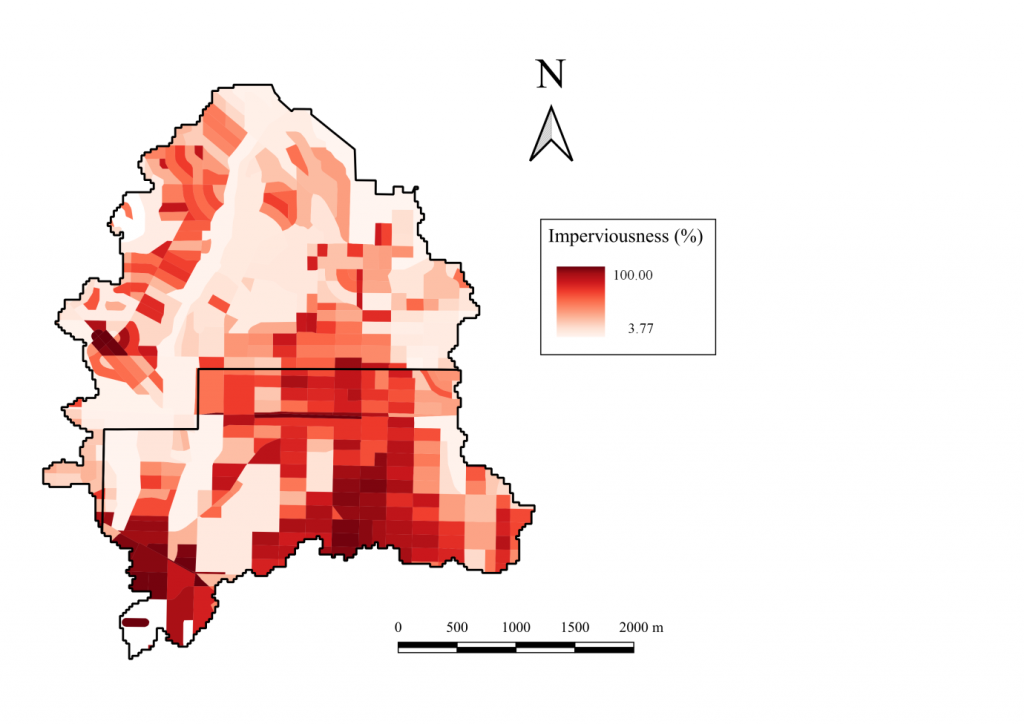
Imperviousness Map
Land use expansion is normally associated with the imperviousness of a drainage basin. Human-centered land uses such as commercial and residential areas have introduced massive amounts of pavements, parking lots, and rooftops. The first two have resulted in soil compaction and impediment of infiltration. Specifically, CNV’s and DNV’s zoning bylaws describe the impervious surface coverage ratio (e.g., building and parking coverage) for each land use. Metro Vancouver (2019) has also conducted an analysis of eco-health indicators (i.e., tree canopies and impervious surfaces) by city block covering both municipalities where the watershed is located (see the figure below, modified from EcoHealth Indicators – Canopy and Imperviousness Map retrieved from Metro Vancouver’s Open Data http://www.metrovancouver.org/data). The block imperviousness map indicates that lower watershed contains more impermeable surfaces compared to the middle watershed.