Historical flood discharge frequency analysis serves as practical criteria to examine the impacts of increases in impervious surface areas and assess the performances of mitigation practices. Increases in certain discharge rates (e.g., discharge rate with two year return periods that has a probability of occurrence of 50% in any given year) might result in larger floods and consequently introduce more runoff that leads to more property damage. The WBM assumes that the interflow and groundwater discharges were ignorable compared to surface runoff, and thus the modelled discharge values equal to surface runoff discharge rates. The frequency analysis of surface runoff is demonstrated in the graphs below.
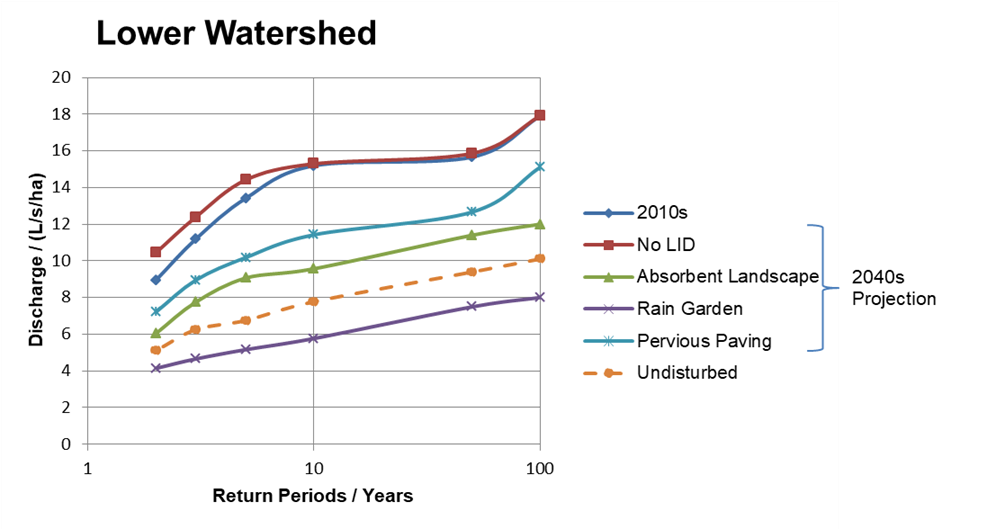
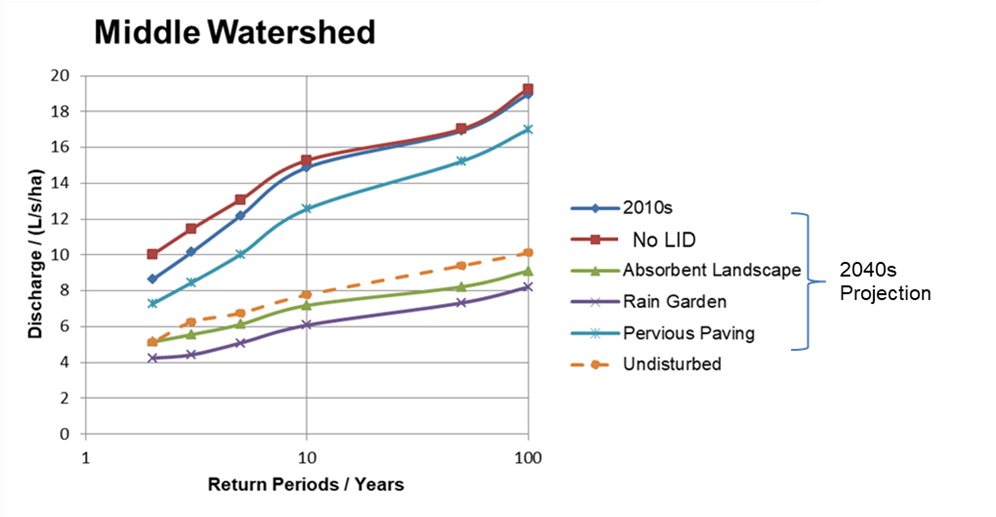
The above graphs illustrate that as the intensification continues, the magnitude of smaller surface runoff discharges (i.e., < 5 year return period) will increase whereas the value of infrequent surface runoff discharges (i.e., > 100 year return period) is not likely to increase as significantly as smaller surface discharges. For instance, the WBM predicted that the two-year discharge that has a probability of occurrence of 50% in any given year would increase from 8.95 L/s/ha for the 2010s watershed condition to a possible 10.45 L/s/ha in the 2040s projection in lower watershed and from 8.63 L/s/ha in the 2010s to 10.02 L/s/ha in the 2040s in the middle watershed. A plausible explanation is that runoff is correlated to impervious surface area changes and the magnitude of larger flood events is more likely to be influenced when urbanization expands to the undisturbed natural surface condition. However, in this case study, the majority of the projected development takes the form of redevelopment/intensification, which shifts the composition of impervious surface areas (i.e., percentage of driveways, rooftops, and buildings) but only introduces little or no new impervious surface areas.
Compared to the middle watershed, the discharge rates are slightly smaller in the lower watershed for both the 2010s and 2040s surface conditions. Only through the application of rain gardens would the values be restored to undisturbed conditions; whereas both absorbent landscapes and rain gardens would reduce the discharge rates to values in the vicinity of the predevelopment level. However, in the middle watershed, absorbent landscapes would more likely be preferred if developers were presented with both absorbent landscapes and rain gardens, as it would incur a lesser financial commitment (capital costs $31,973 – 41,476/unit for absorbent landscapes compared to $31,973 – 41,476/unit for rain gardens, Toronto and Region Conservation Authority, 2013).
 Follow