Peak Flow Rates (L/s/ha) and Related Occurrence Time
The WBM was set up as a planning tool to compare changes to the lower and middle watershed due to altered land uses and implementation of mitigation practices. The model generated a summary table of discharge rates listing several values over a range determined by the surface conditions for each area, including peak flow rates and the related occurrence time. The modelled results under 2010s, 2040s, and future scenario with LID practices are listed in the table below.
Modelled Peak Flow Rates and Occurrence Time
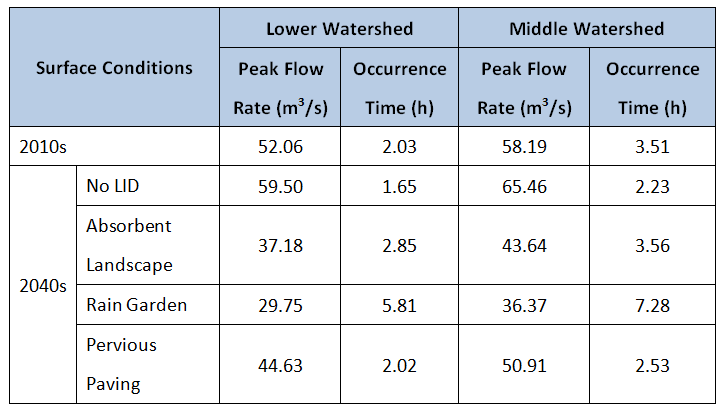
It can be observed from the above table that if no LID practices are applied to the study area, the peak flow rates in both lower and middle watershed will increase and intensification will shorten the peak flow occurrence time, which is potentially due to shifts in impervious surface areas (e.g., percentage changes in driveways and sidewalks). All three selected LID practices resulted in a reduction in peak flow rates and delays in the occurrence time, among which rain gardens exhibited the most compelling performance in both the lower and the middle watershed, followed by absorbent landscapes and pervious paving. The plausible explanation for the differences in peak flow rates and performances of selected LID practices is that lower watershed experiences less frequent runoff-causing precipitation events (i.e. Tier B and Tier C events) and due to more impervious surface area in the lower watershed, the soil water holding capacity has decreased significantly (Abu-hashim et al., 2015); thus solely enhancing the surface condition (e.g., adopting absorbent landscapes) might fail to effectively retain the excessive rainwater and LID practices with storage (e.g. rain gardens) would be preferable.
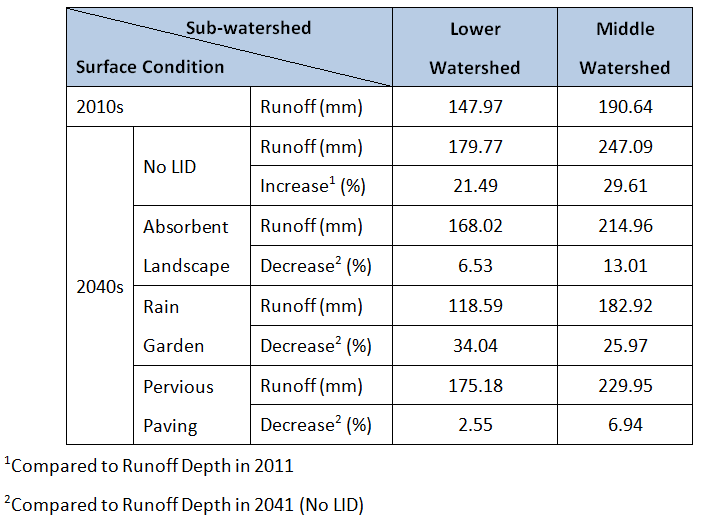
Direct Runoff Depths
In comparison with the above modelling results, more obvious changes can be observed in the direct runoff depths in both lower and middle watershed. The table below lists the direct runoff depths calculated in each scenario simulating 24h rainfall over 40 mm events (Tier B and Tier C events). Similar to trends in peak flow and the relevant occurrence time, intensification/redevelopment would result in increases in direct runoff depths. As middle watershed experiences more frequent runoff-causing precipitation events, consequently, the area would be subjected to greater depths of runoff; meanwhile, the intensification/redevelopment processes would result in greater increases in runoff depths in middle watershed than lower watershed (29.61% increase in the middle watershed compared to 21.49%. increase in the lower watershed). Mitigation effects are most significant when rain gardens are applied in both lower and middle watershed, followed by absorbent landscapes and pervious paving.
Modelled Direct Runoff Depths in Study Area