Comparisons of infrastructure investment models between traditional procurement and public-private-partnerships (P3’s) are often affected by an “optimism bias” and sensitive to the choice of discount rate[1]. An evaluation between procurement models must weigh the benefits against the costs of project complexity, transaction costs, and the associated risks of each project. This post aims to clarify the challenges and opportunities each procurement model operates under, against these three conditions.
COMPLEXITY
Project complexity is a product of both the nature of the asset, the geological/environmental conditions of the property, and the social, cultural and political environment in which the project must operate. Planning, constructing and managing physical assets requires a diversity of professional experience. These competencies are often not well aligned with those of government employees/ departments and there is a strong case for harnessing private sector expertise in complex projects[2].
The benefits of the P3 model over traditional procurement have been found to be maximized in cases with high complexity2; however, the efficacy of the P3 model diminishes in cases where legal and regulatory issues are difficult to evaluate. This is especially true for projects on First Nations land or dealing with vulnerable groups. In these cases, high complexity works to drive up perception of risk and can affect the pricing of risk transfer2.
The decision-making process can also create additional complexity, especially when decisions must be made across overlapping jurisdictional bodies. This is especially evident in jurisdictions with a federal system of government, when financial decisions are made at both federal and provincial/state levels2.
For political and strategic reasons, the procurement process of the P3 model is also cloaked in secrecy with a low level of public transparency and accountability by design[3],6. This secrecy increases complexity and creates an uncertain arena for actors to navigate, driving up transaction costs throughout the process7. In contrast to traditional procurement however, the issue becomes less pronounced and often the same arguments are made for both models2.
Large infrastructure projects have a high degree of complexity and even with the P3 model, no two projects are the same2. To reduce complexity of P3 projects, some argue the public sector should increase transparency across projects and across sectors – sharing learnings and experiences to increase forethought and standardize efficiencies for public benefit[4]. To counter this argument, others point out that P3’s require such a high degree of individual project tailoring that standardization of the process is unrealistic6.
TRANSACTION COSTS
One of the critiques of increased private sector participation through P3’s is the corresponding increase in transaction costs – i.e. costs associated with building a partnership between private and public actors. Transaction costs are all costs associated with gathering information, organising and participating in the competitive bidding process negotiating the contract, monitoring and enforcement of contract compliance, and renegotiation of the contract over the full life-cycle of the project[5],6. This can include legal costs (advisory fees for investment bankers and lawyers), financial costs (placement fees) and technical costs (geotechnical and environmental studies, staff and consultant fees)[6],[7]. Technical costs have been found to be less important in determining overall transaction costs when compared to the legal and financial costs of dealing with governments7.
Transaction costs have been found to vary widely between sectors and are generally higher for smaller projects or those with long procurement periods6. While Klein et al. find the main factors for variability of transaction cost are stability of the policy landscape and familiarity of actors within this landscape7; a more recent study by Dudkin and Välilä suggest the main factors for high transaction costs in P3’s are the long-term nature of the contract and the effect of risk sharing/ risk transfer to the private proponent6. Progress toward resolution of all factors gives rise to increasingly high transaction costs.
In jurisdictions with a well-developed policy landscape Klein et al. found transaction costs to be approximately three to five percent (3-5%) of the total project cost, while in developing countries these costs can rise to as high as ten to twelve percent (10-12%) of total cost7. Dudkin and Välilä suggest a threshold value for minimum project size of at least $25 million USD is needed for a P3 to be economically viable in the UK. Further, they estimate transaction costs between three to twenty-five percent (3-25%) with an average estimate of more than ten percent (10%) of the total project value6.
Transaction costs are hidden in the total cost and information is most often limited and confidential. Traditional procurement methods also include transaction costs; however, the P3 model works to incorporate some of the hidden costs into the cost of transaction through project negotiation. Under the P3 model, a portion of these costs are transferred to taxpayers and consumers of the service in the form of tolls or availability payments from the public sector. While the up-front transaction costs are indeed larger than those amassed under traditional procurement, these costs include the provision of improved long-term monitoring and enforcement which can lower the total cost over the project lifetime7, however this is not always the case6.
Klein et al. suggest the increased transaction costs under the P3 model are the “costs of the transition to a new way of doing business”7. They argue that transaction costs will naturally fall over time as:
- governments and private proponents become more familiar with the P3 process
- more projects are completed, and lessons can be shared between sectors
- governments adopt better policies and improve monitoring and enforcement
ASSOCIATED RISKS
The increase in negotiation and up-front scrutiny of P3 projects may increase transaction costs, but it is also expected to shift a portion of risk from the public sector (shouldered by taxpayers and consumers) to the private partner and create allocative efficiency over the project life-span. This risk transfer may not be applicable for all forms of risk (risk of soil contamination is often retained by the public sector), and there are some types of risk that are better shared between the partners (traffic risk)[8].
Risk valuation is inherently subjective; however, procurement agencies often standardize the quantification of these risks drawing on past experiences to assess which types of risk should be transferred and which to be retained by the public sector8. While this expectation of risk sharing is theoretically sound, in practice Vining et al find considerable variation in the degree to which private partners actually assume this risk[9]. Private firms are profit maximising entities skilled in the art of minimizing risk. In order for effective risk transfer to the private sector partner, it is essential that the public sector design contracts which ensure private sector partners are compensated for, and actually bear the risk6.
Regardless of procurement type – either traditional or P3 – risk is always present and accounted for in varying degrees. The real value of a P3 model is the degree in which the public sector evaluates and identifies risks, and how these risks are allocated to actors most able to bear them
VALUE FOR MONEY COMPARISON
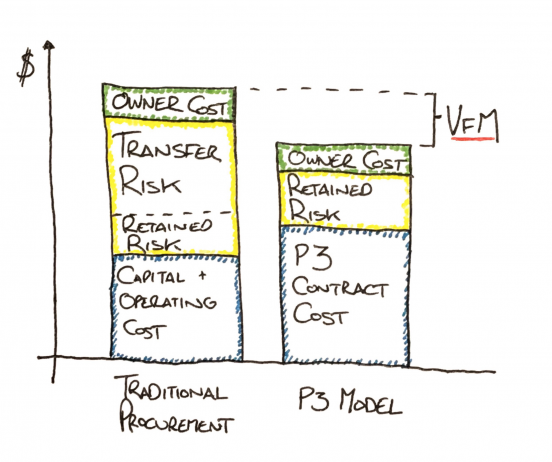
The true value of a P3 investment – as compared to traditional procurement – can be estimated using a Value for Money (VfM) analysis. This conceptual tool calculates the estimated cost of each project option against quantitative and qualitative metrics. The quantitative component of the VfM assessment is based on lowest project cost of the two options, while the qualitative component assesses the qualitative goals of each project. These qualitative goals are normally assessed using constructed measures (scored elements) which are difficult to quantify, such as travel time or amount of natural light. Indeed, the provision of most services are difficult to measure qualitatively6.
Once the transaction costs have been quantified and the risks allocated efficiently, the VfM analysis will illustrate the cost comparison of the two options as a quantified value, usually in dollar value.
LITERATURE CITED
[1] Parks & Terhart (2009). Evaluation of Public Private Partnerships – Costing and Evaluation Methodology. Blair Mackay Mynett Valuations Inc. for Canadian Union of Public Employees (2009).
[2] Boothe. P, Boudreault. F, Hudson. D, Moloney. D, Octaviani. S (2015) The procurement of Public Infrastructure: Comparing P3 and Traditional Approaches. Ivey Business School, Lawrence National Centre for Policy and Management. London, Ontario (2015).
[3] Boase (2000). Beyond Government? The Appeal of Public-Private Partnerships. Canadian Public Administration. Vol. 43, No. 1 pp. 75-92 (2000).
[4] Globerman. S, Vining. A (1996). A Framework for Evaluating the Government Contracting Out Decision with an Application to Information Technology. Public Administration Review. Vol. 56, No. 6 pp. 577-586 (1996).
[5] Coase. R. (1937). The Nature of the Firm. Economica. Vol. 4 pp 386-405 (1937).
[6] Dudkin. G & Valila. T (2012). Transaction Costs in Public-Private Partnerships: A First Look
at the Evidence. Competition and Regulation in Network Industries. Vo. 1, No. 2 (2006).
[7] Klein. M, So. J, Shin. B (1996). Transaction Costs in Private Infrastructure Projects – Are they too High? The World Bank Group – Private Sector Development Department. Note No. 95 (1996).
[8] Iacobacci. M (2010) Dispelling the Myths: A Pan-Canadian Assessment of Public-Private Partnerships for Infrastructure Investments. Conference Board of Canada. January (2010).
[9] Vining. A, Boardman. A, Poschmann. F (2005). Public-Private Partnerships in the US and Canada: “There are No Free Lunches”. Journal of Comparative Policy Analysis. Vol. 7, No. 3 pp. 199-220 (2005).