I was surprised to see the multigraph created by Deirdre Dagar, James Seaton, and I made. We had an incredibly high level of connectivity between all three of us with a connectivity degree of 7 shared choices. Deirdre and James in particular shared a connectivity degree of 9 with each other whereas I had a degree of connectivity of 8 with either of them. From an aesthetic standpoint, there is a pleasing near-symmetry to our graph.
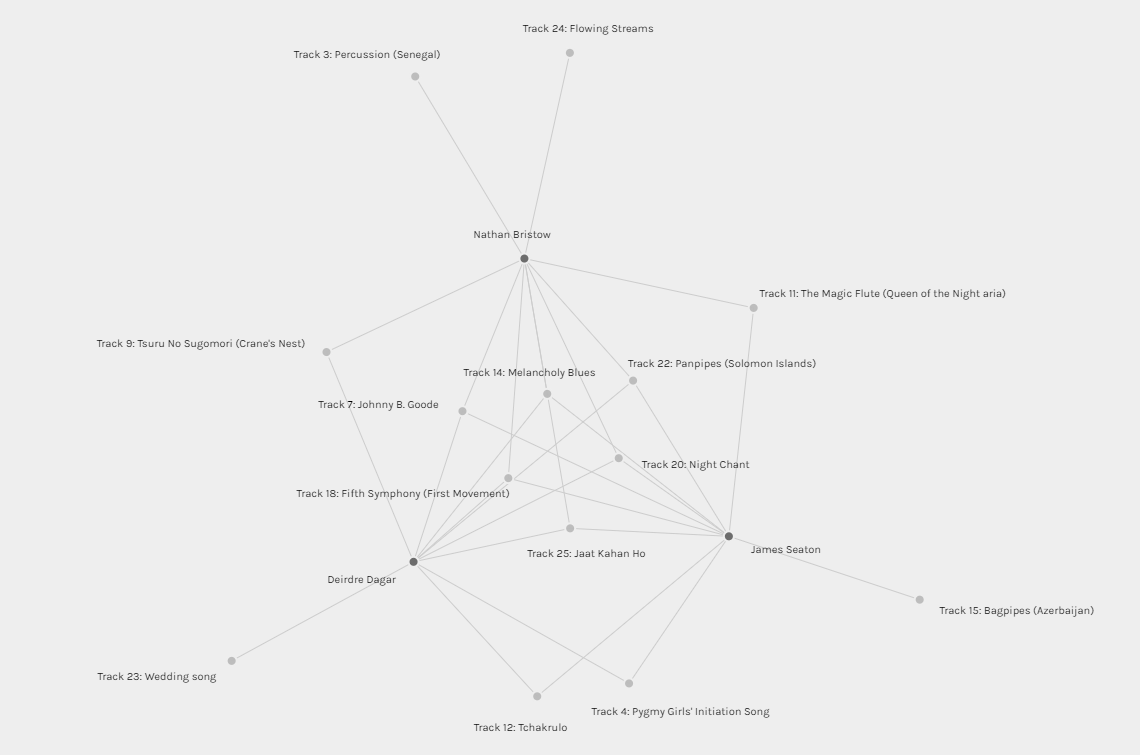
A very pleasing geometric shape
Based on the visualizations, we have the least differences in connectivity between all the groups with each member only having one or, in my case two separate choice(s) from the others. Despite our strong connectivity with each other, when compared to the rest of the class we are on the fringe with limited connectivity to the rest of our peers. The ethnic homogeneity of our group could be a possible explanation for our grouping but could simply be a superficial relationship.
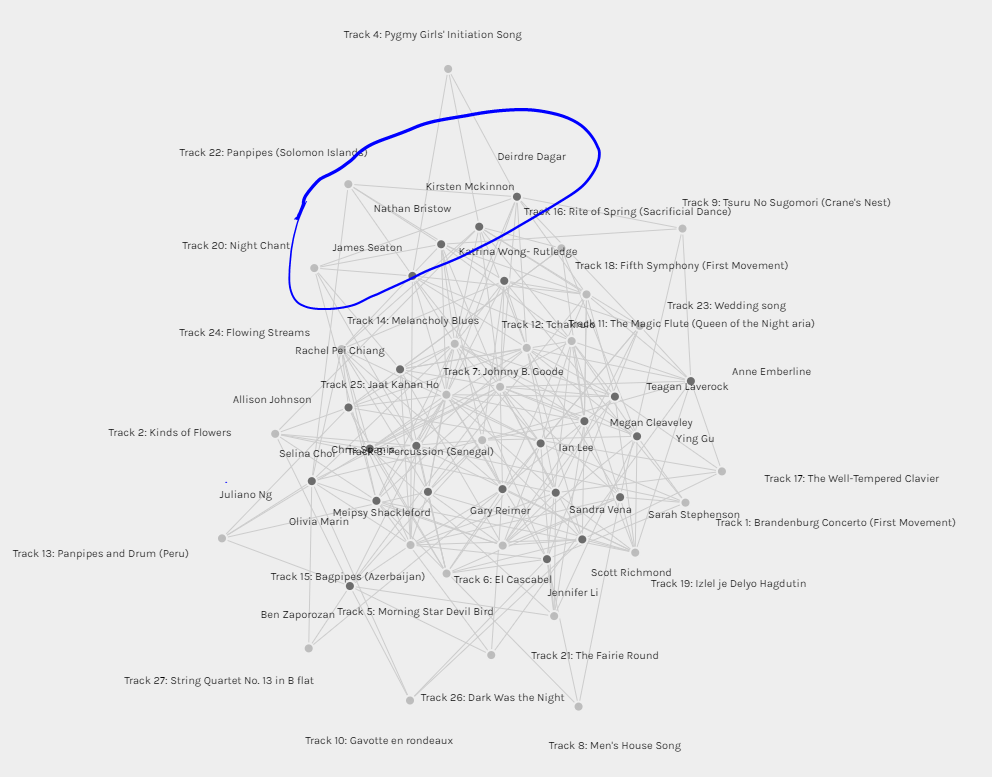
Here we find our grouping on the fringe of the class as a whole
I originally did not believe the visualizations could intrinsically capture the reasoning behind the choices. I thought that it could, at best, incorrectly guide my own analysis to make an assumption that Deirdre and James had similar thoughts/criteria to my own. As I examine their responses to Task #8 however, common threads and criteria do appear: choosing songs with pleasing audio quality, showcasing talent/ability, anthropomorphizing the probes, and choosing songs that represent cultures other than our own (as we are all white individuals). It is interesting to be confronted with my own skepticism where, in the Age of Disinformation, I’ve spent so long training myself to question how data is presented to me that I am resistant to quickly drawing conclusions from data. It is important to realize that this is near-raw data that has undergone minimal manipulation (beyond the sorting algorithm which is still a potential source of skewing) and actually serves to strengthen the relationships between Deirdre’s, James’, and my choices. I feel this common set of criteria we shared does in fact even reflect the “null” choices in the data and the reason for the very similar choices the three of us made. The data reinforces this, showing how each of our dissimilar choices involved choosing another culture which fell into our shared criteria and we wished to have represented on the Golden Record.
It would be interesting to re-examine this assignment with the role of trying to “game the system” and finding the optimal set of songs which maximize your connectivity – similar to trying to increase traffic to a website. This would be a difficult task as it would be a constantly shifting environment based on the ever-changing choices from class to class which would be reflective of the fluid structure of the interconnectivity of the internet.
References:
- Code.org. (2017, June 13). The Internet: How Search Works . Retrieved from https://youtu.be/LVV_93mBfSU
- Systems Innovation. (2015, April 18). Graph Theory Overview. Retrieved from https://youtu.be/82zlRaRUsaY
- Systems Innovation. (2015, April 19). Network Connections . Retrieved from https://youtu.be/2iViaEAytxw