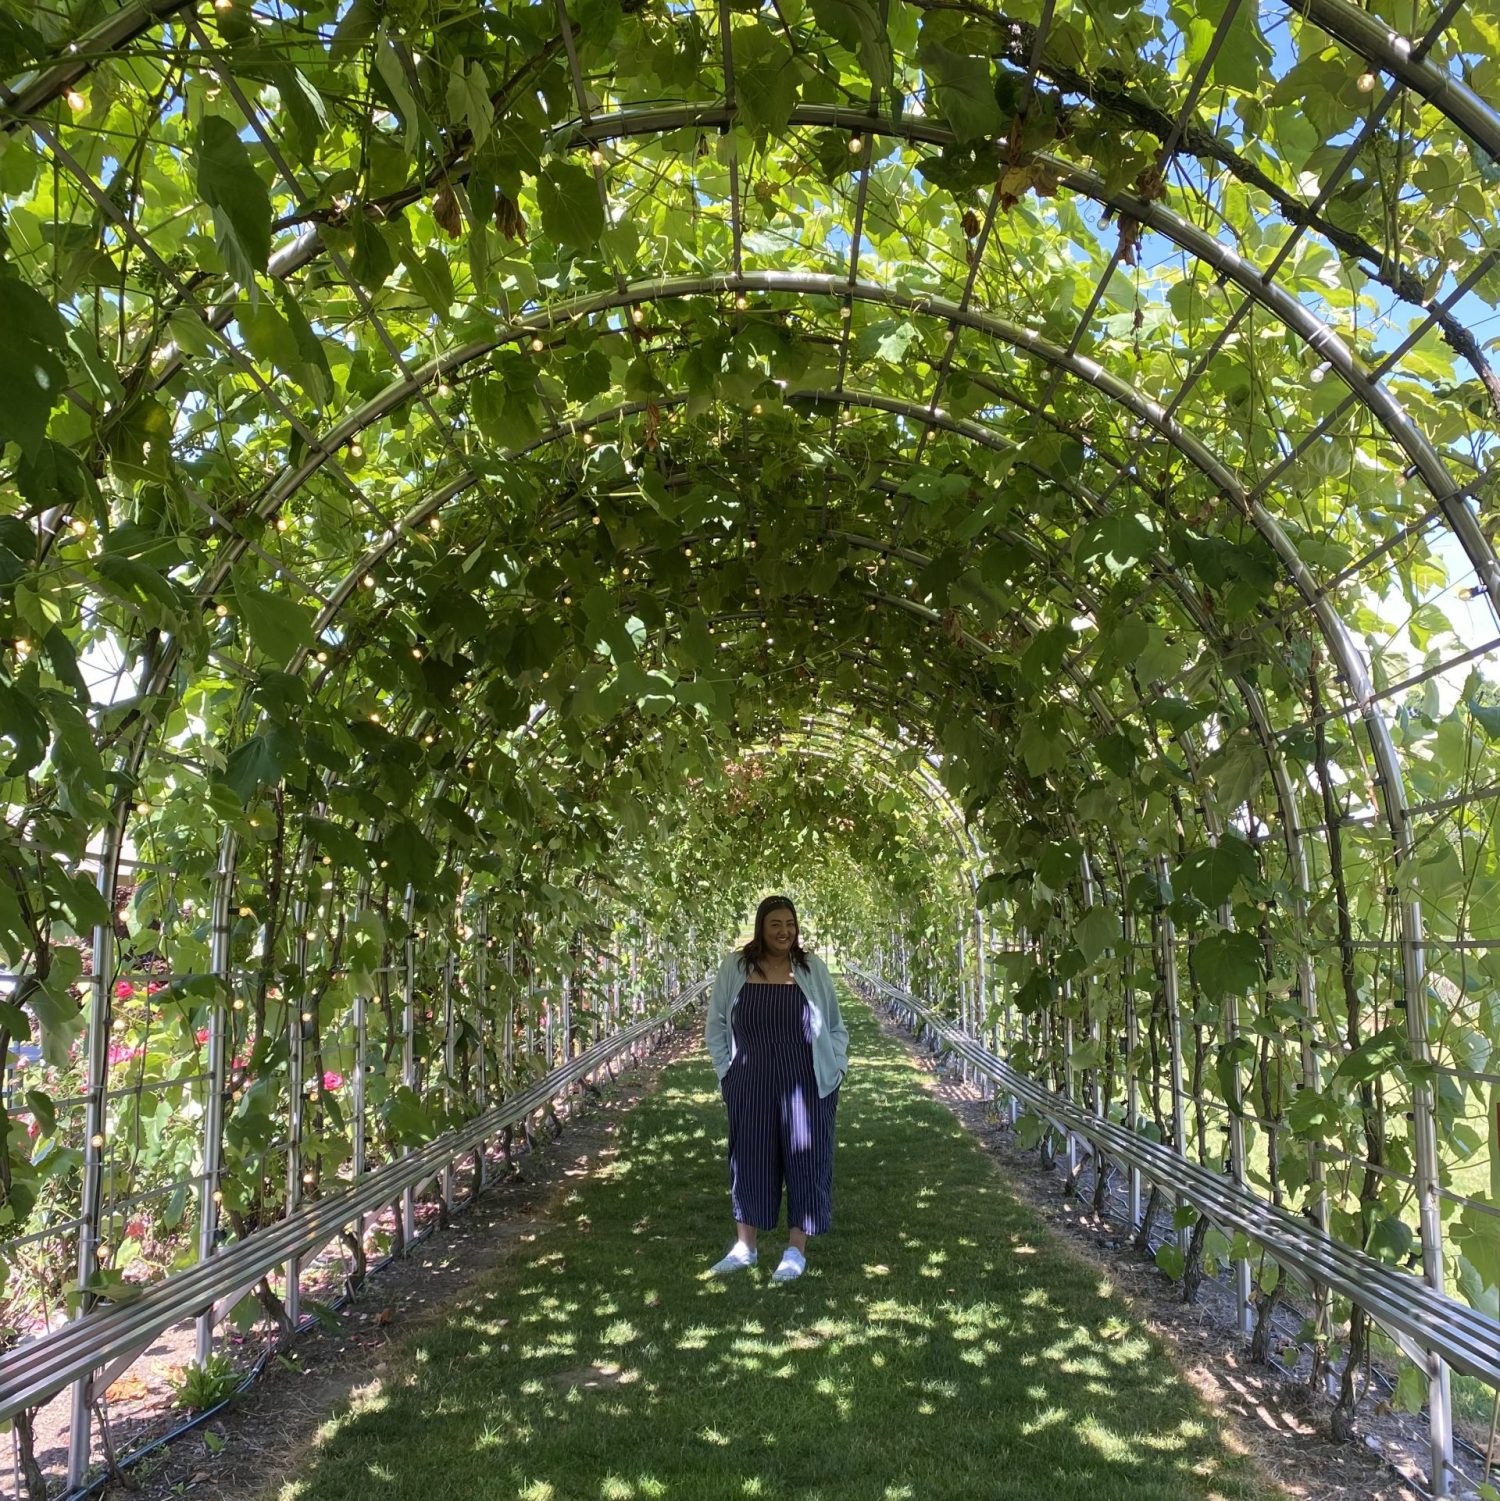
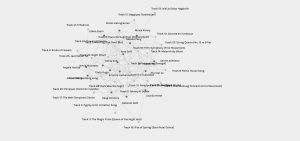
Using the Palladio website to interpret our class network database from the Golden Record curation task for me was a new experience that came with some frustrations due to lack of understanding this learning tool. I liked how the tool was able to show the songs that were chosen and the mutual connections that formed form this which me some time to understand. I had not understood what each node represented but I learned that, “The degree of a node in a network is a measure of the number of connections it has to other nodes. This degree of connectivity can be interpreted in terms of the immediate likelihood of a node catching whatever is flowing through the network…” (Systems Innovation, 2015). Despite understanding this, I still found looking at my own name and interpreting all the connections I had and where they all lead to quite challenging to look at. Additionally, what I found most frustrating was a lack of explanation or other source of data to interpret these results. What I expected from this assignment was to be able to see which songs were chosen by my classmates and to be able to see how we aligned and possibly how we differed but I think that would require much more data to be collected in the survey our class took.
In terms of looking at the specific data that the Palladio data shows, I was curious to see how many connections there were to certain song choices and how few there were to other song notions. I found it interesting to see that there were so many connections to specific songs which meant that many people had chosen them in their own personal top ten lists. This made me curious about whether or not my colleagues and I shared the same reasonings for putting those songs on our lists. It was also curious to note that a few songs had very few connections and a couple I noted had no nodes, which meant no connections. They were all songs that I did not include on my top ten list either, so I was curious as to why others omitted these songs from their lists as well. This got me thinking about the Palladio data, and how, although, it does show connections to data, it does not provide reasonings for the data which leaves out a lot of room for interpretations. For me, I have the ability to go to my colleagues’ blogs and read about their song choices, but how often to people looking at data in similar fashions to this, have access to doing that?
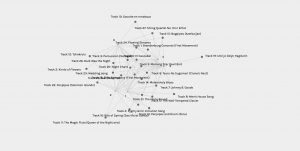
As helpful and transformative looking at and understanding data and network connections can be, there are often times many pieces to the puzzle that remain missing when interpreting these results which could lead to skewed opinions and understandings of the data. It is important to think about what information is being presented to us and what information is left behind, whether intentionally or not. It is our responsibility as consumers of media and information to look at what we see, whether that be scientific data or not, with a critical lens.
References
Palladio. (n.d.). Retrieved March 11, 2023, from https://hdlab.stanford.edu/palladio-app/#/upload
Systems Innovation. (2015, April 19). Network Connections [Video]. YouTube. https://www.youtube.com/watch?v=2iViaEAytxw&t=12s.