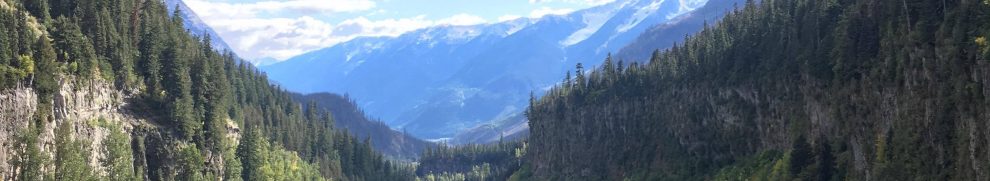
Lahars are a type of mudflow, composed of pyroclastic material, rocky debris and water. Their volumes can reach up to 109 cubic meters, and peak discharge may exceed 107 cubic meters per second. They occur when hot volcanic material erupts onto snow and ice, or from a large discharge of water (through rainfall or rapid melt) where water begins to entrain old volcanic sediment – a situation Mount Meager could and does find itself in many months of the year. In addition to carrying the initial volcanic material down the slope, they have a tremendous capacity to entrain material as they travel; lahars can grow up to ten times their initial size. Their destructive potential should not be underestimated, and therefore are very important when assessing the hazards associated with any volcano which has snow cover at any point in the year.
Lahar from the 1982 eruption of Mt. St. Helens. Note the eruption of material onto snow/glacial cover and subsequent runout (from https://en.wiktionary.org/wiki/lahar).
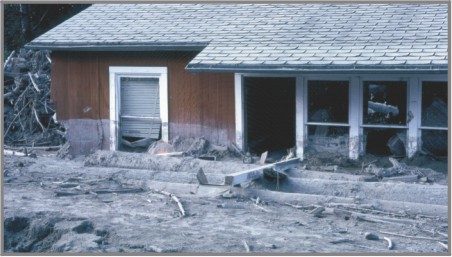
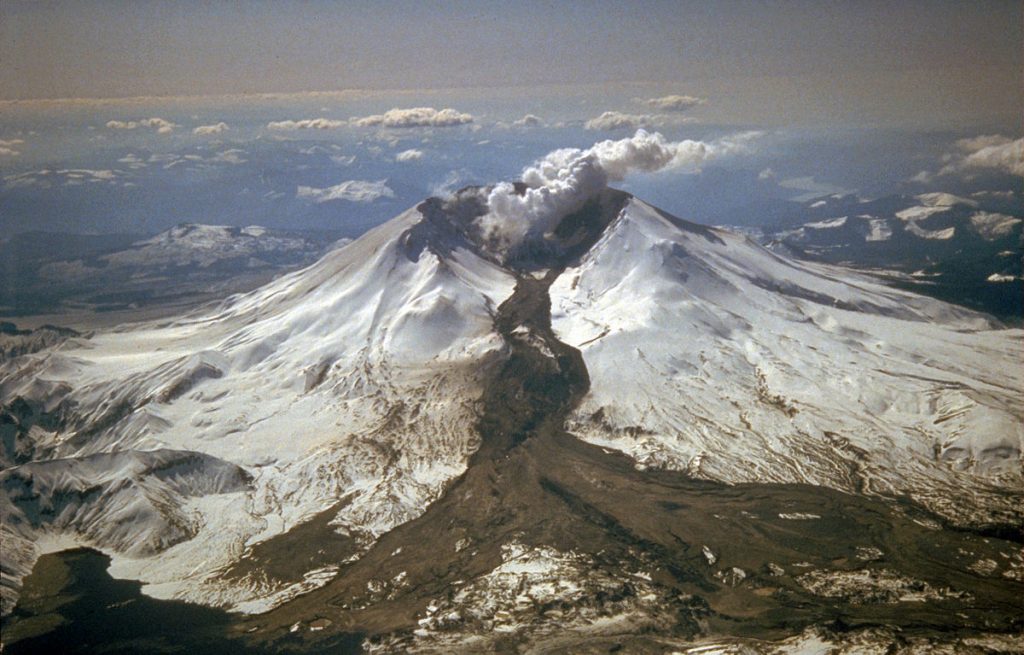
A partially buried house by lahar following the 1980 eruption of Mt. St. Helens (from https://pubs.usgs.gov/fs/2000/fs060-00/).
Methodology: Modelling of lahars originating from the current vent at Mount Meager – the Bridge River Vent – was done using Laharz_py software developed by the USGS. Data used for the simulation was accumulated from GeoGratis. A large DEM which extends slightly past Pemberton was used. The first step in analysis was to create surface hydrology rasters using the Create Surface Hydrology Rasters in the Laharz_py toolbox. Four new rasters were created: (1) a filled DEM (same as the Fill tool in the Hydrology toolset of ArcGIS) to fill sinks in the initial DEM, (2) a flow direction raster, (3) a flow accumulation raster, and (4) a stream raster. The next step was to create a proximal hazard zone boundary using the Hazard Zone Proximal tool. Here, the X and Y coordinates of the Bridge River Vent were entered, along with the H/L ratio of the cone (Energy Cone software used uses the same method. See Lavas and Pyroclastic Flows under Methods and Results). A H/L ratio of 0.3 was used for the Mt. Meager Volcanic Complex (this ratio is varied in Energy Cone analyses). The resulting shapefile was used by the program to complete analyses. Finally, lahar inundation zones were created using the Lahar Distal Zones tool in the Laharz_py toolbox. Here, the filled DEM, a volume text file and a vent coordinates text file were entered. Volumes used are stated below (Results) and the five lahars were modelled (Figure 1).
Results: Five hypothetical volumes were tested to encompass the entire spectrum of possibilities: 100,000 m3, 1,000,000 m3, 10,000,000 3, 100,000,000 m3, and 500,000,000 m3 (half the size of the largest lahar ever recorded). The results of this simulation are shown below (Figure 1). The smallest lahars are indicative of what could happen during the summer, when there is low snow and ice cover, while the largest lahars are likely more representative of lahars that could occur during the winter months. These simulations suggest that even the smallest lahars place existing infrastructure and lives near the complex at great risk, while the largest simulations place lives far down the Lillooet River at great risk. Since lahars have the capacity to travel extremely quickly, the workers and residents along the valley would need to be notified as soon as possible about the hazard if they are to have any chance of avoiding becoming a casualty.
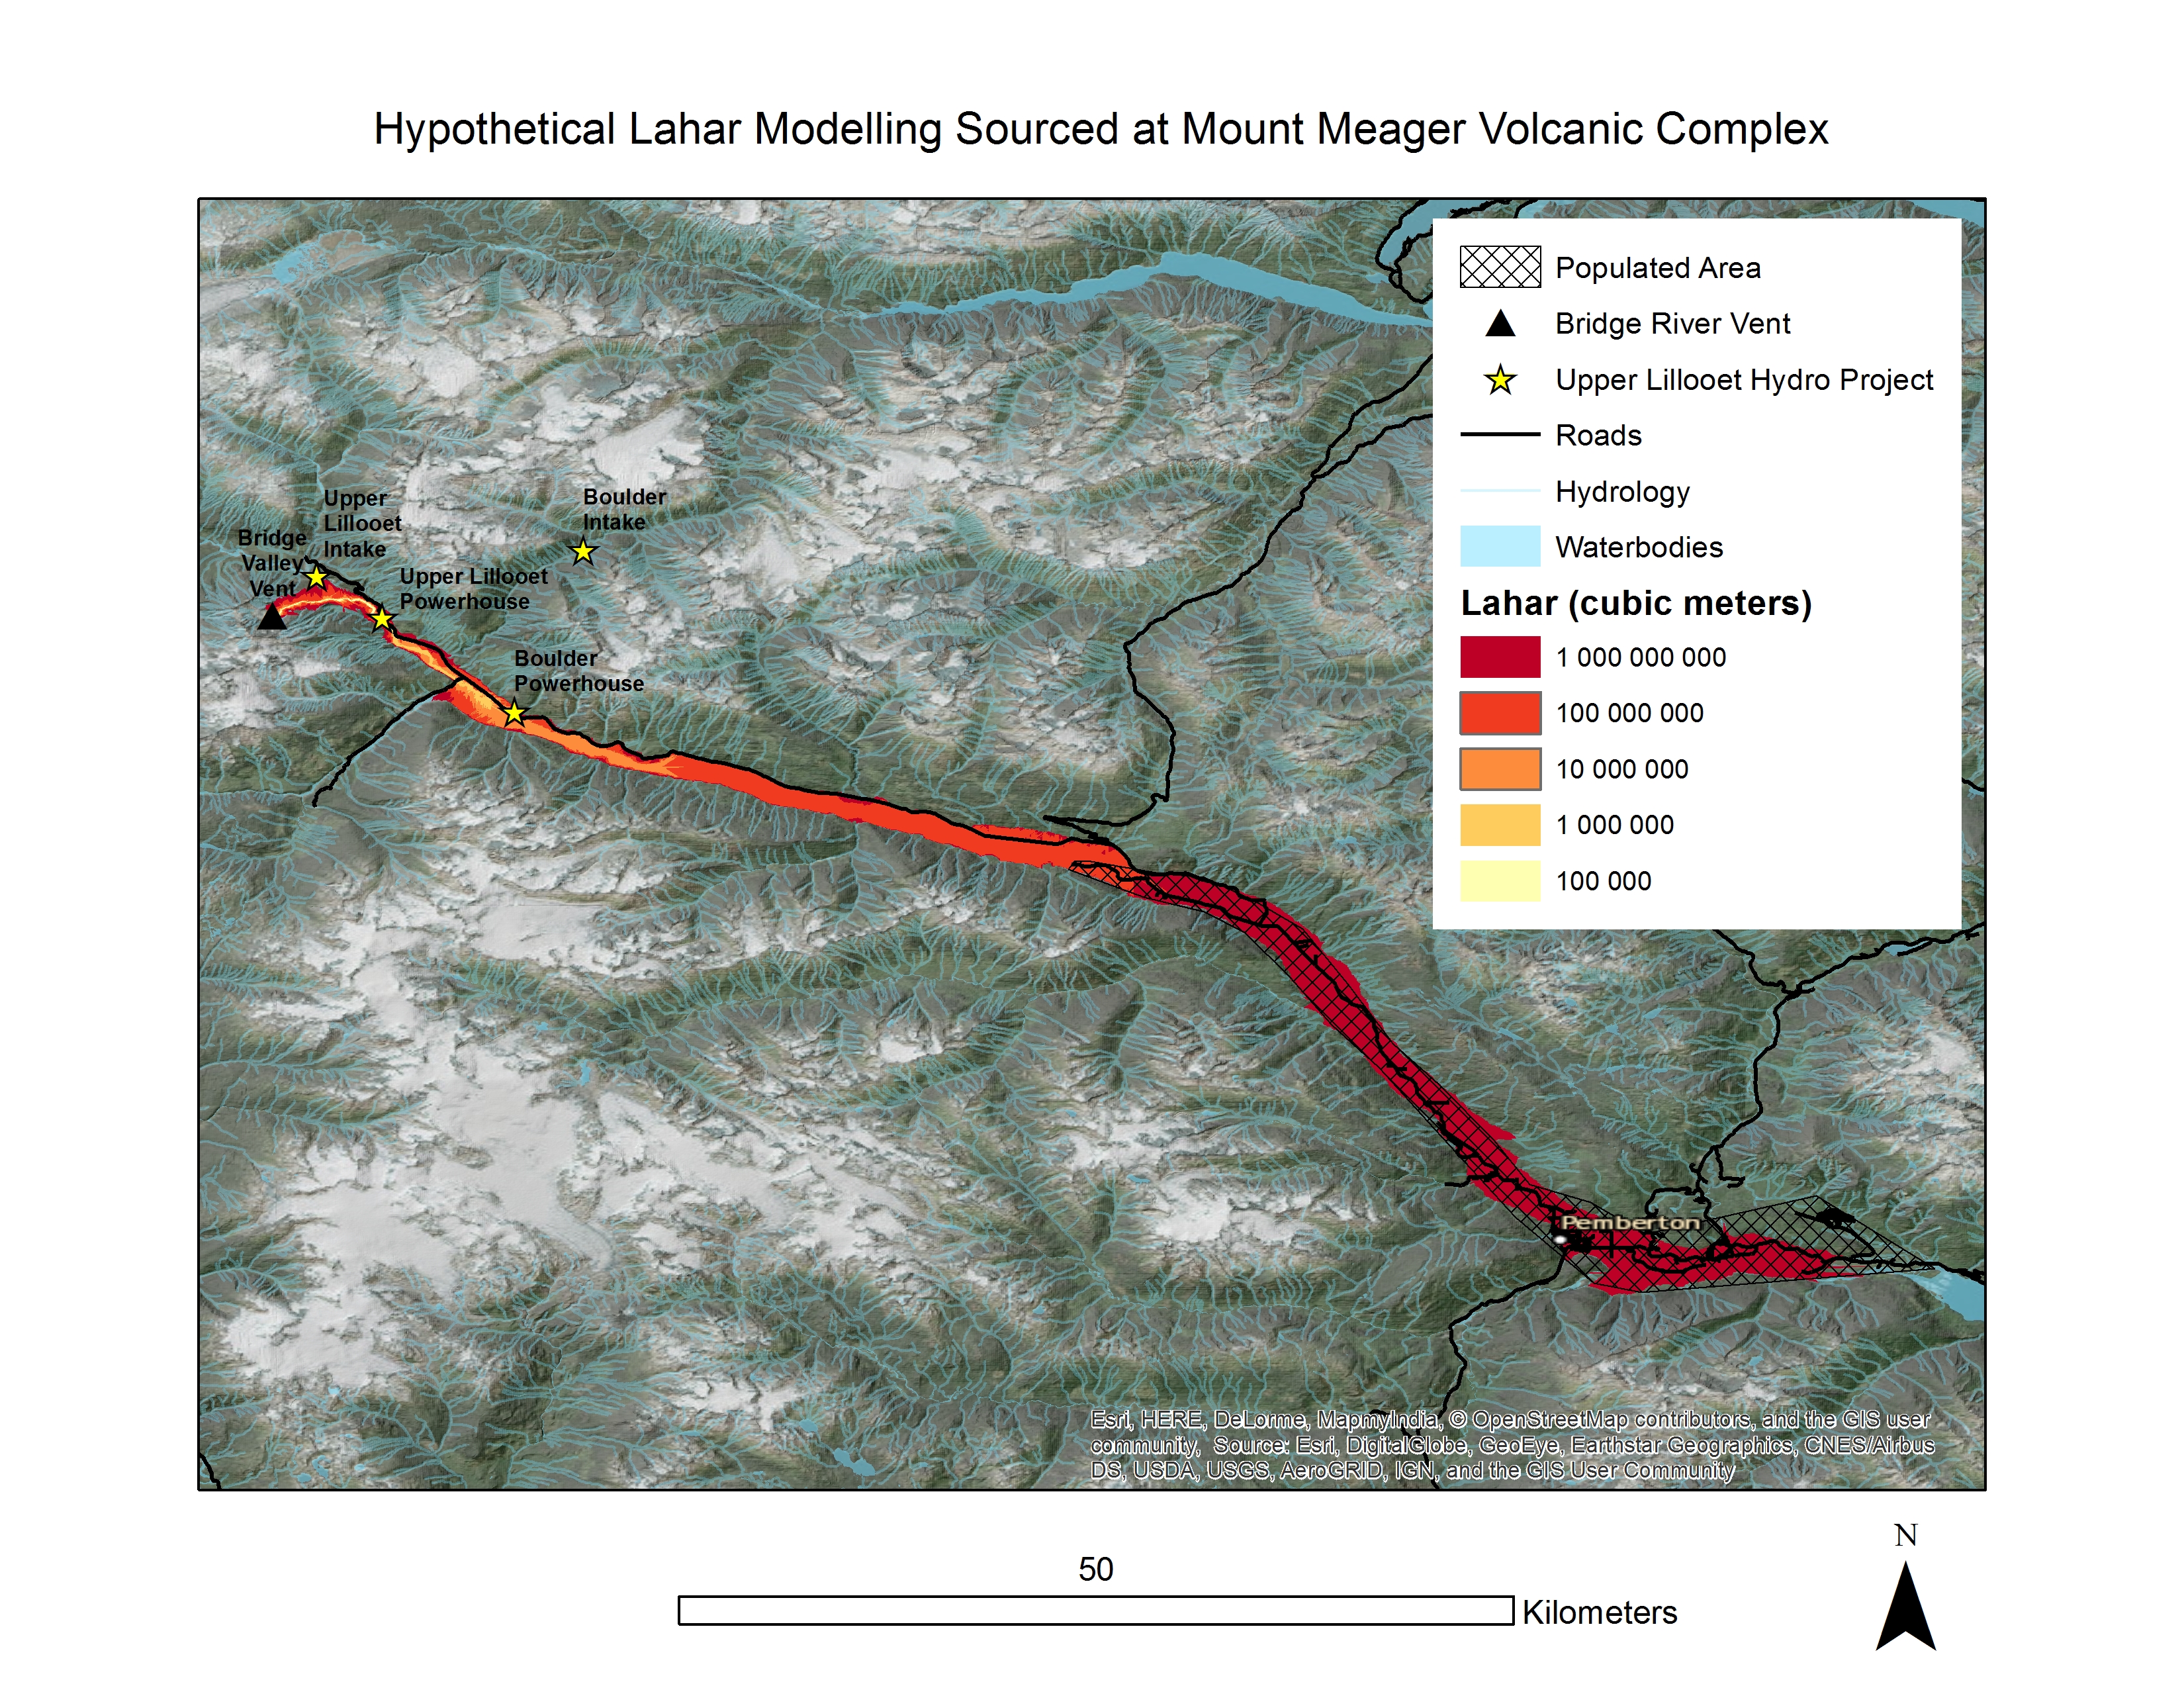
Figure 1: Hypothetical lahar modelling sourced at the Mount Meager Volcanic Complex. A very large lahar has the capacity to impact human settlement over 80 kilometers from the source. Smaller lahars have an ability to destroy established infrastructure near the vent, although several other hazards have the ability to cause additional damage in this instance.