Lavas and pyroclastic flows are two very different volcanic phenomena, but form in close proximity and within the same timespan during explosive eruptions. Mount Meager lavas tend not to travel far due to their very high viscosity, and are not a prominent hazard relatively (relatively – near the vent they are extremely dangerous). Pyroclastic flows however, are an important consideration. They are created when an eruption column can no longer support itself through convection, and hot material falls back to Earth. Once it hits the Earth, it begins to flow, destroying anything in its path.
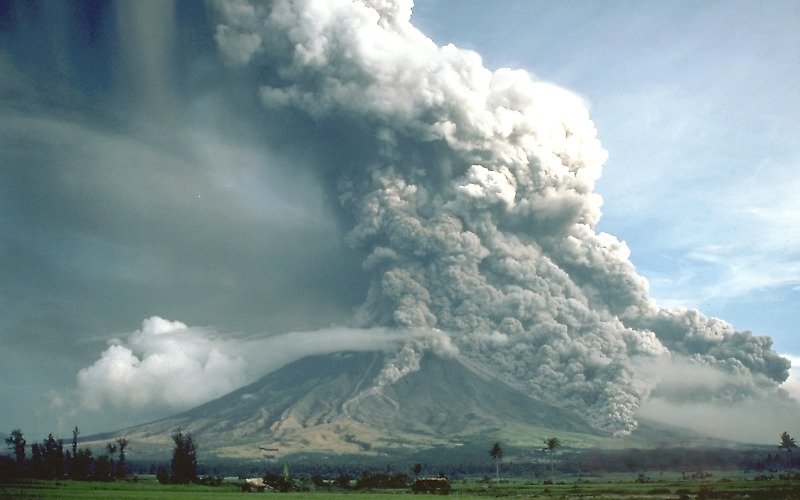
Figure 1: Pyroclastic flows traveling down the flanks of Mayon Volcano, Philippines in 1984 (from https://en.wikipedia.org/wiki/Pyroclastic_flow).
Methodology: Potential extents of lava and pyroclastic flows were modelled using Energy Cone, an application on the research platform VHUB. The inputs for the program are shown below in Figures 1 and 2. To prepare the data for analysis, the DEM used for the area was converted to ASCII format. Once analyses were run, the output KMZ file was returned back into the Arc environment using the KML to layer tool. Three simulations where H/L = 0.05 (largest), 0.1 and 0.25 (smallest) were run to represent three relatively sized eruptions.
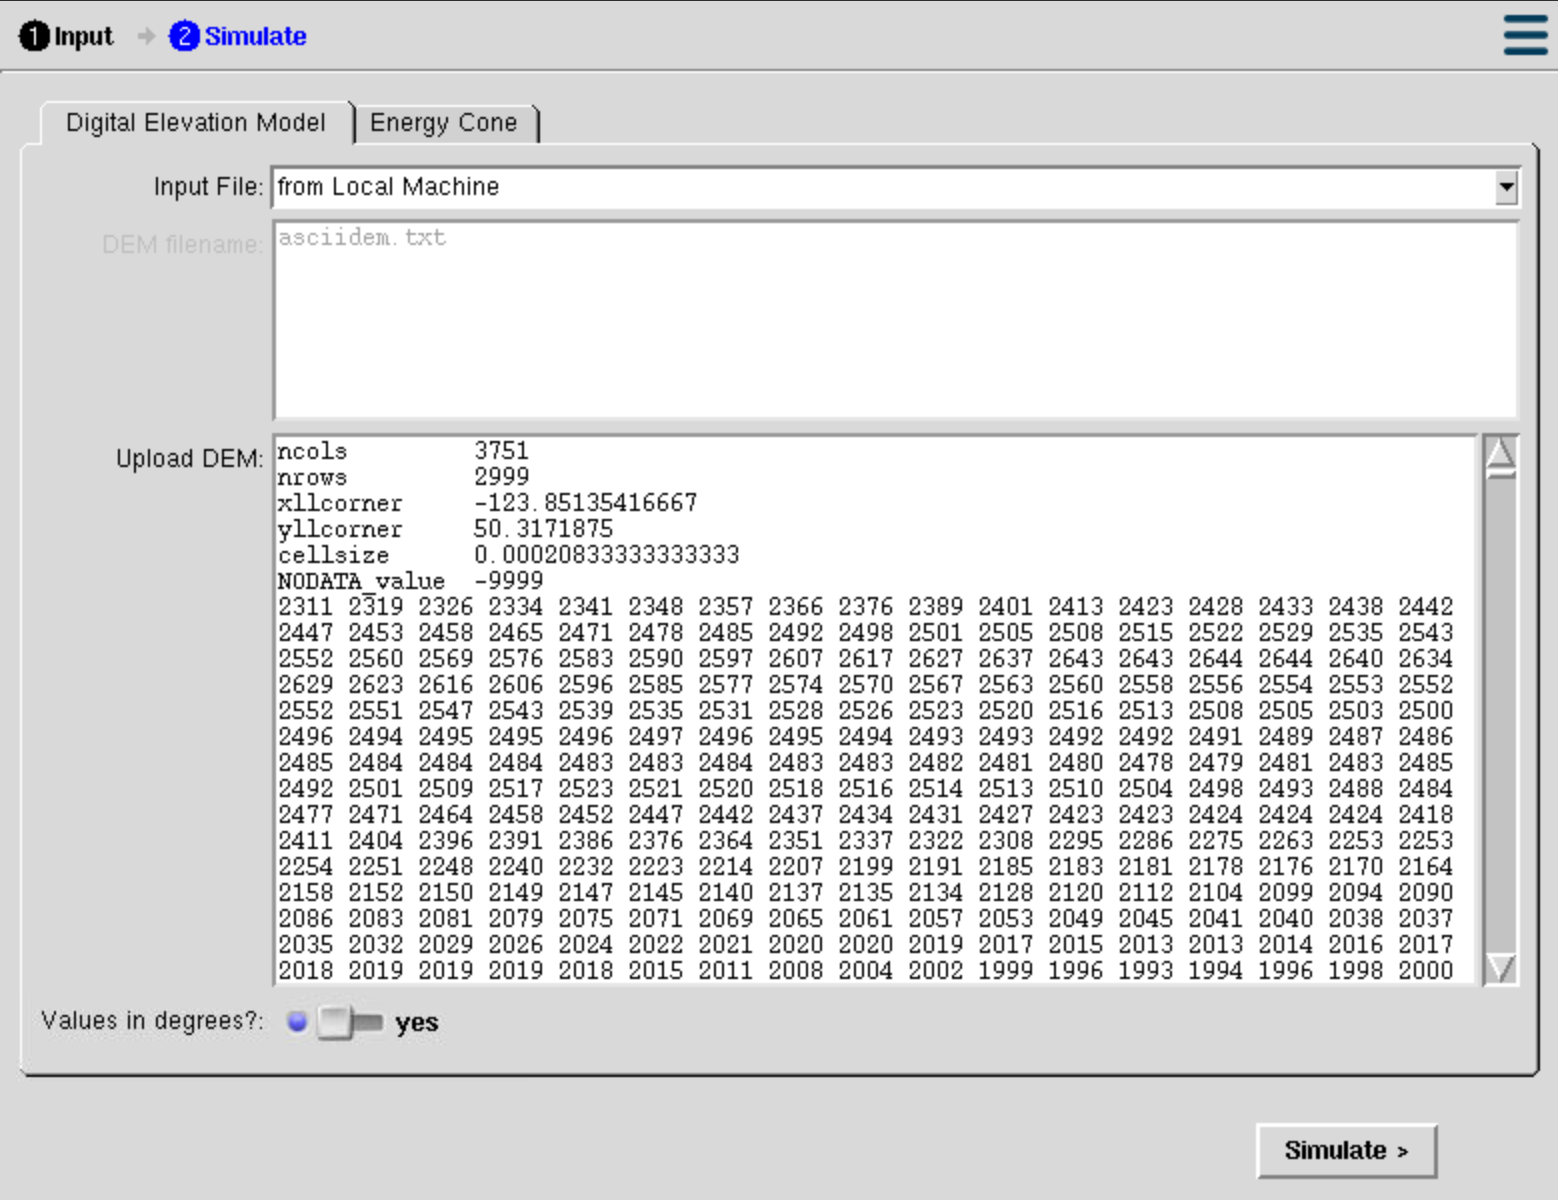
Figure 1: DEM in ASCII format in the Energy Cone interface.

Figure 2: One variation of variable inputs to the Energy Cone software. The H/L ratio was changed three times to represent three different eruptions.
Results:
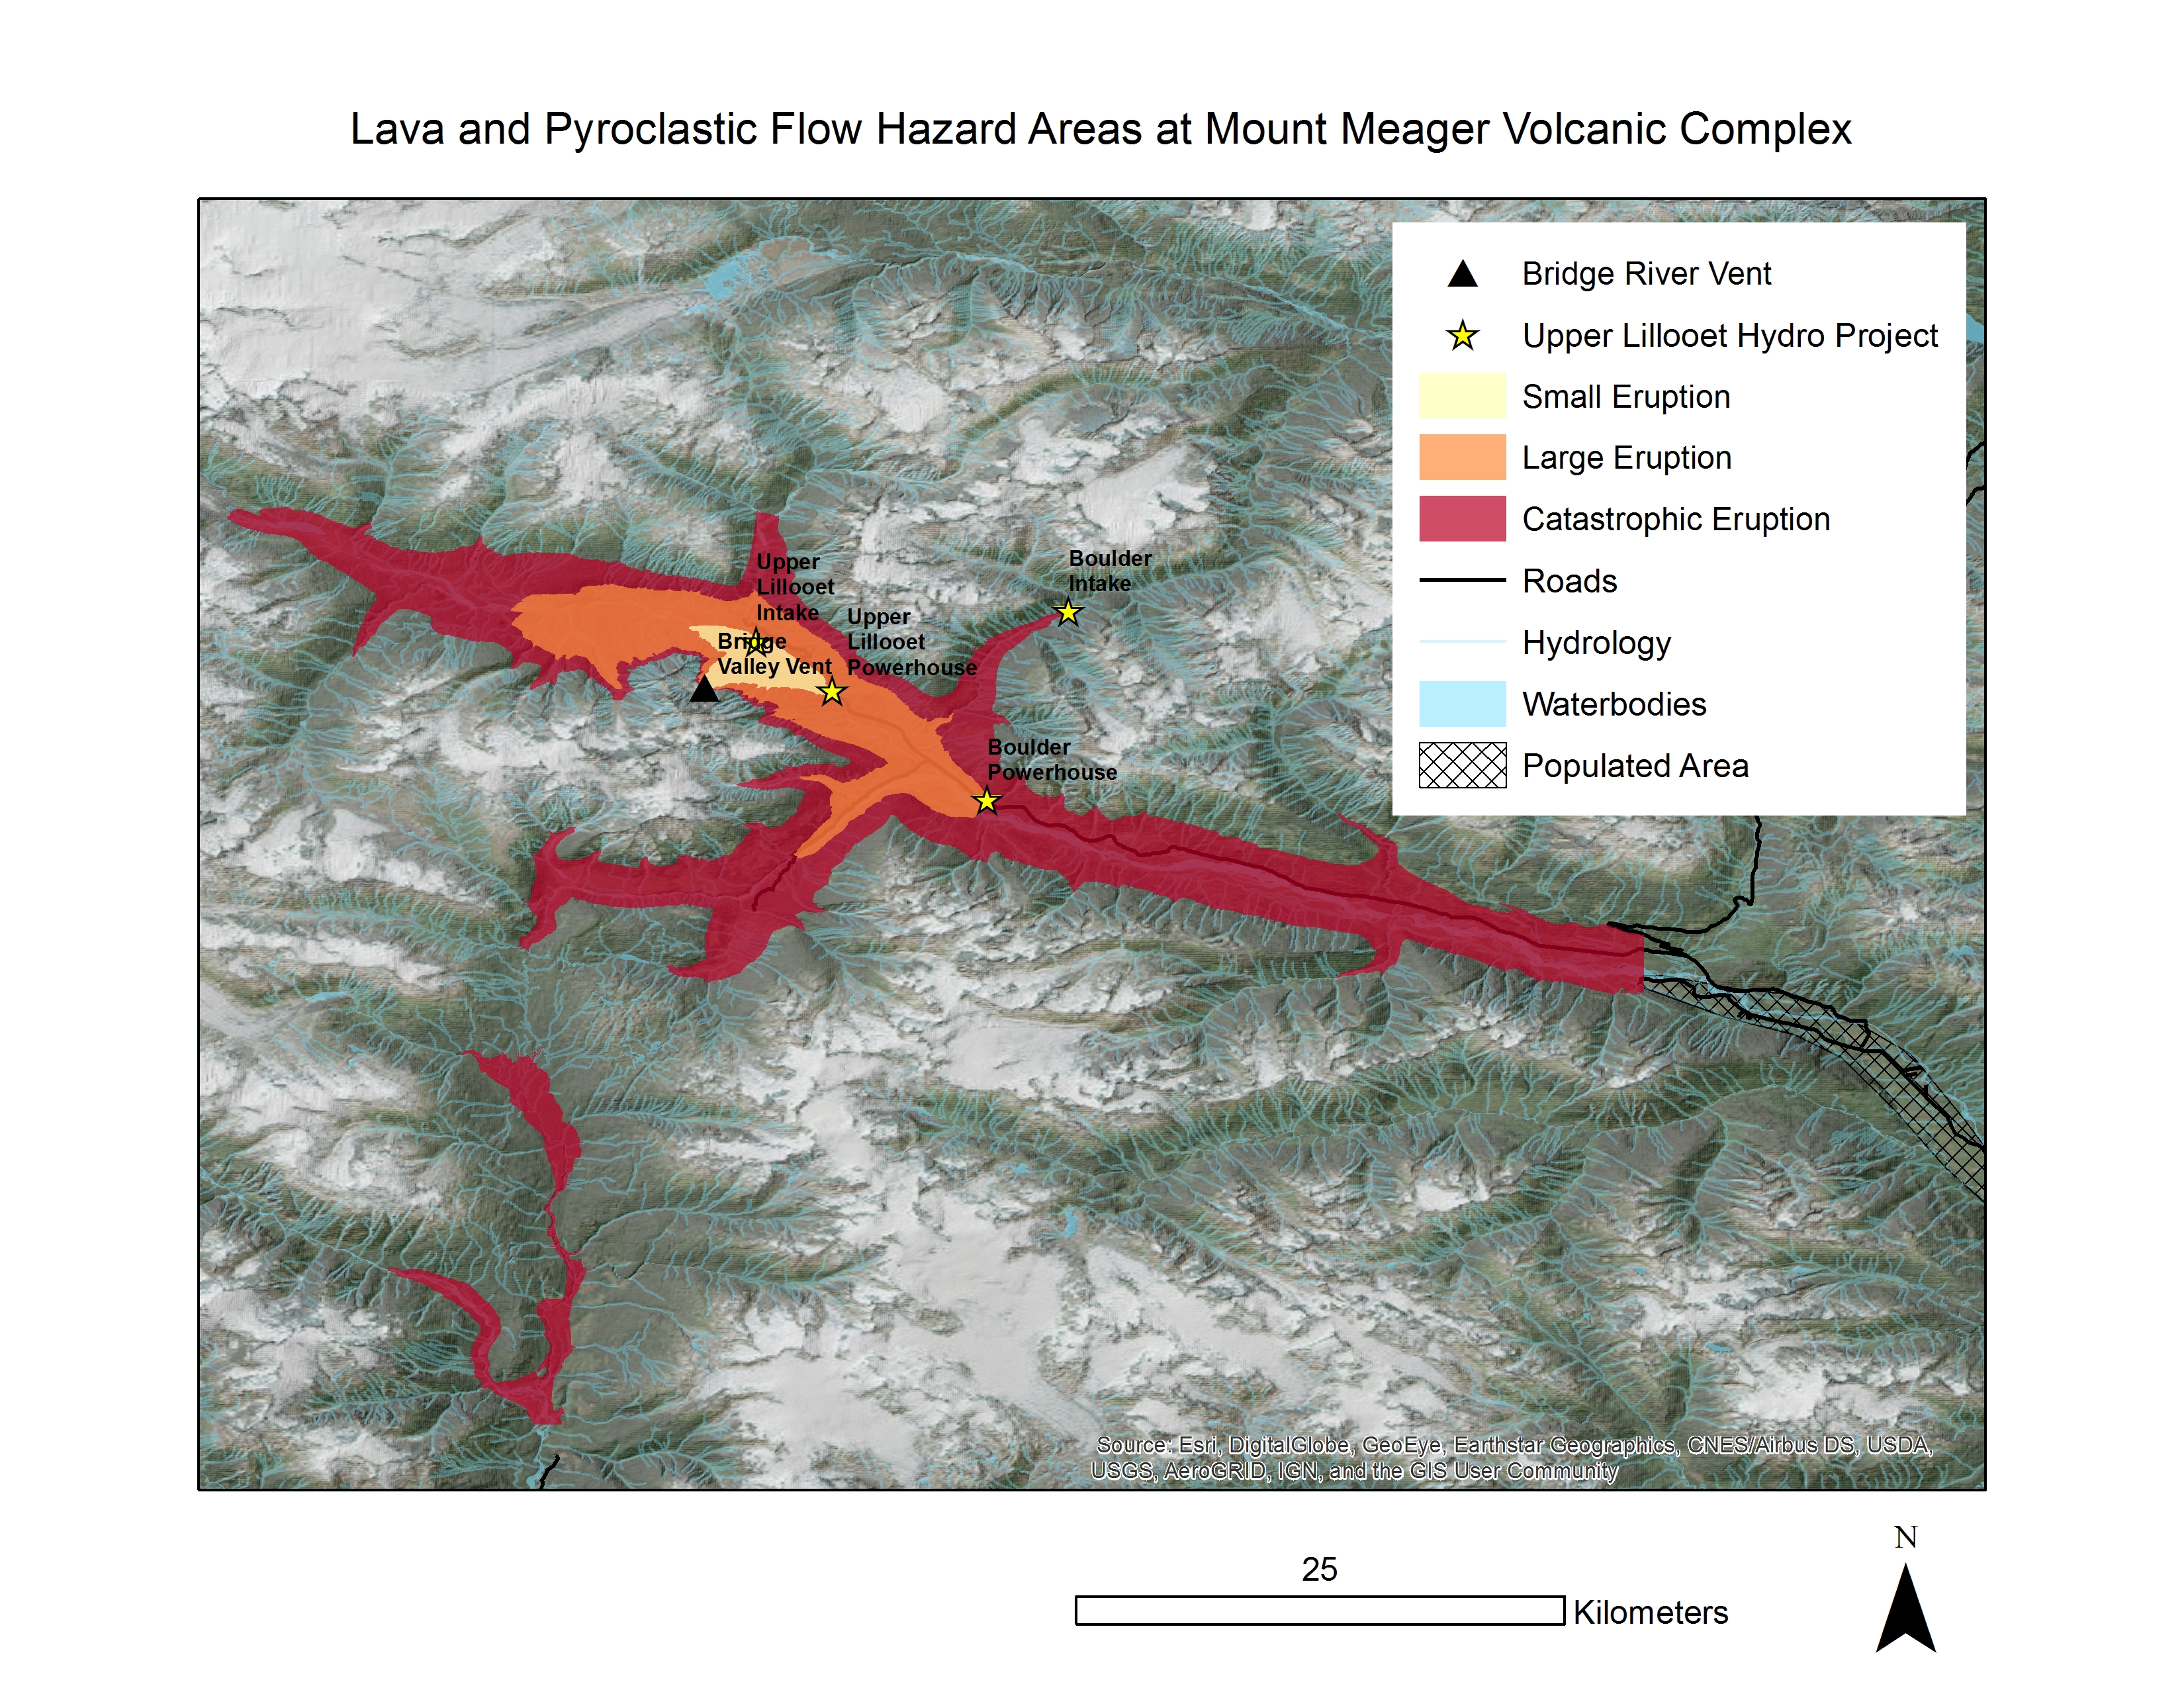
Figure 3: Lava and pyroclastic flow hazard areas at Mount Meager Volcanic Complex. Note the potential for a catastrophic eruption to reach the limits of populated areas.
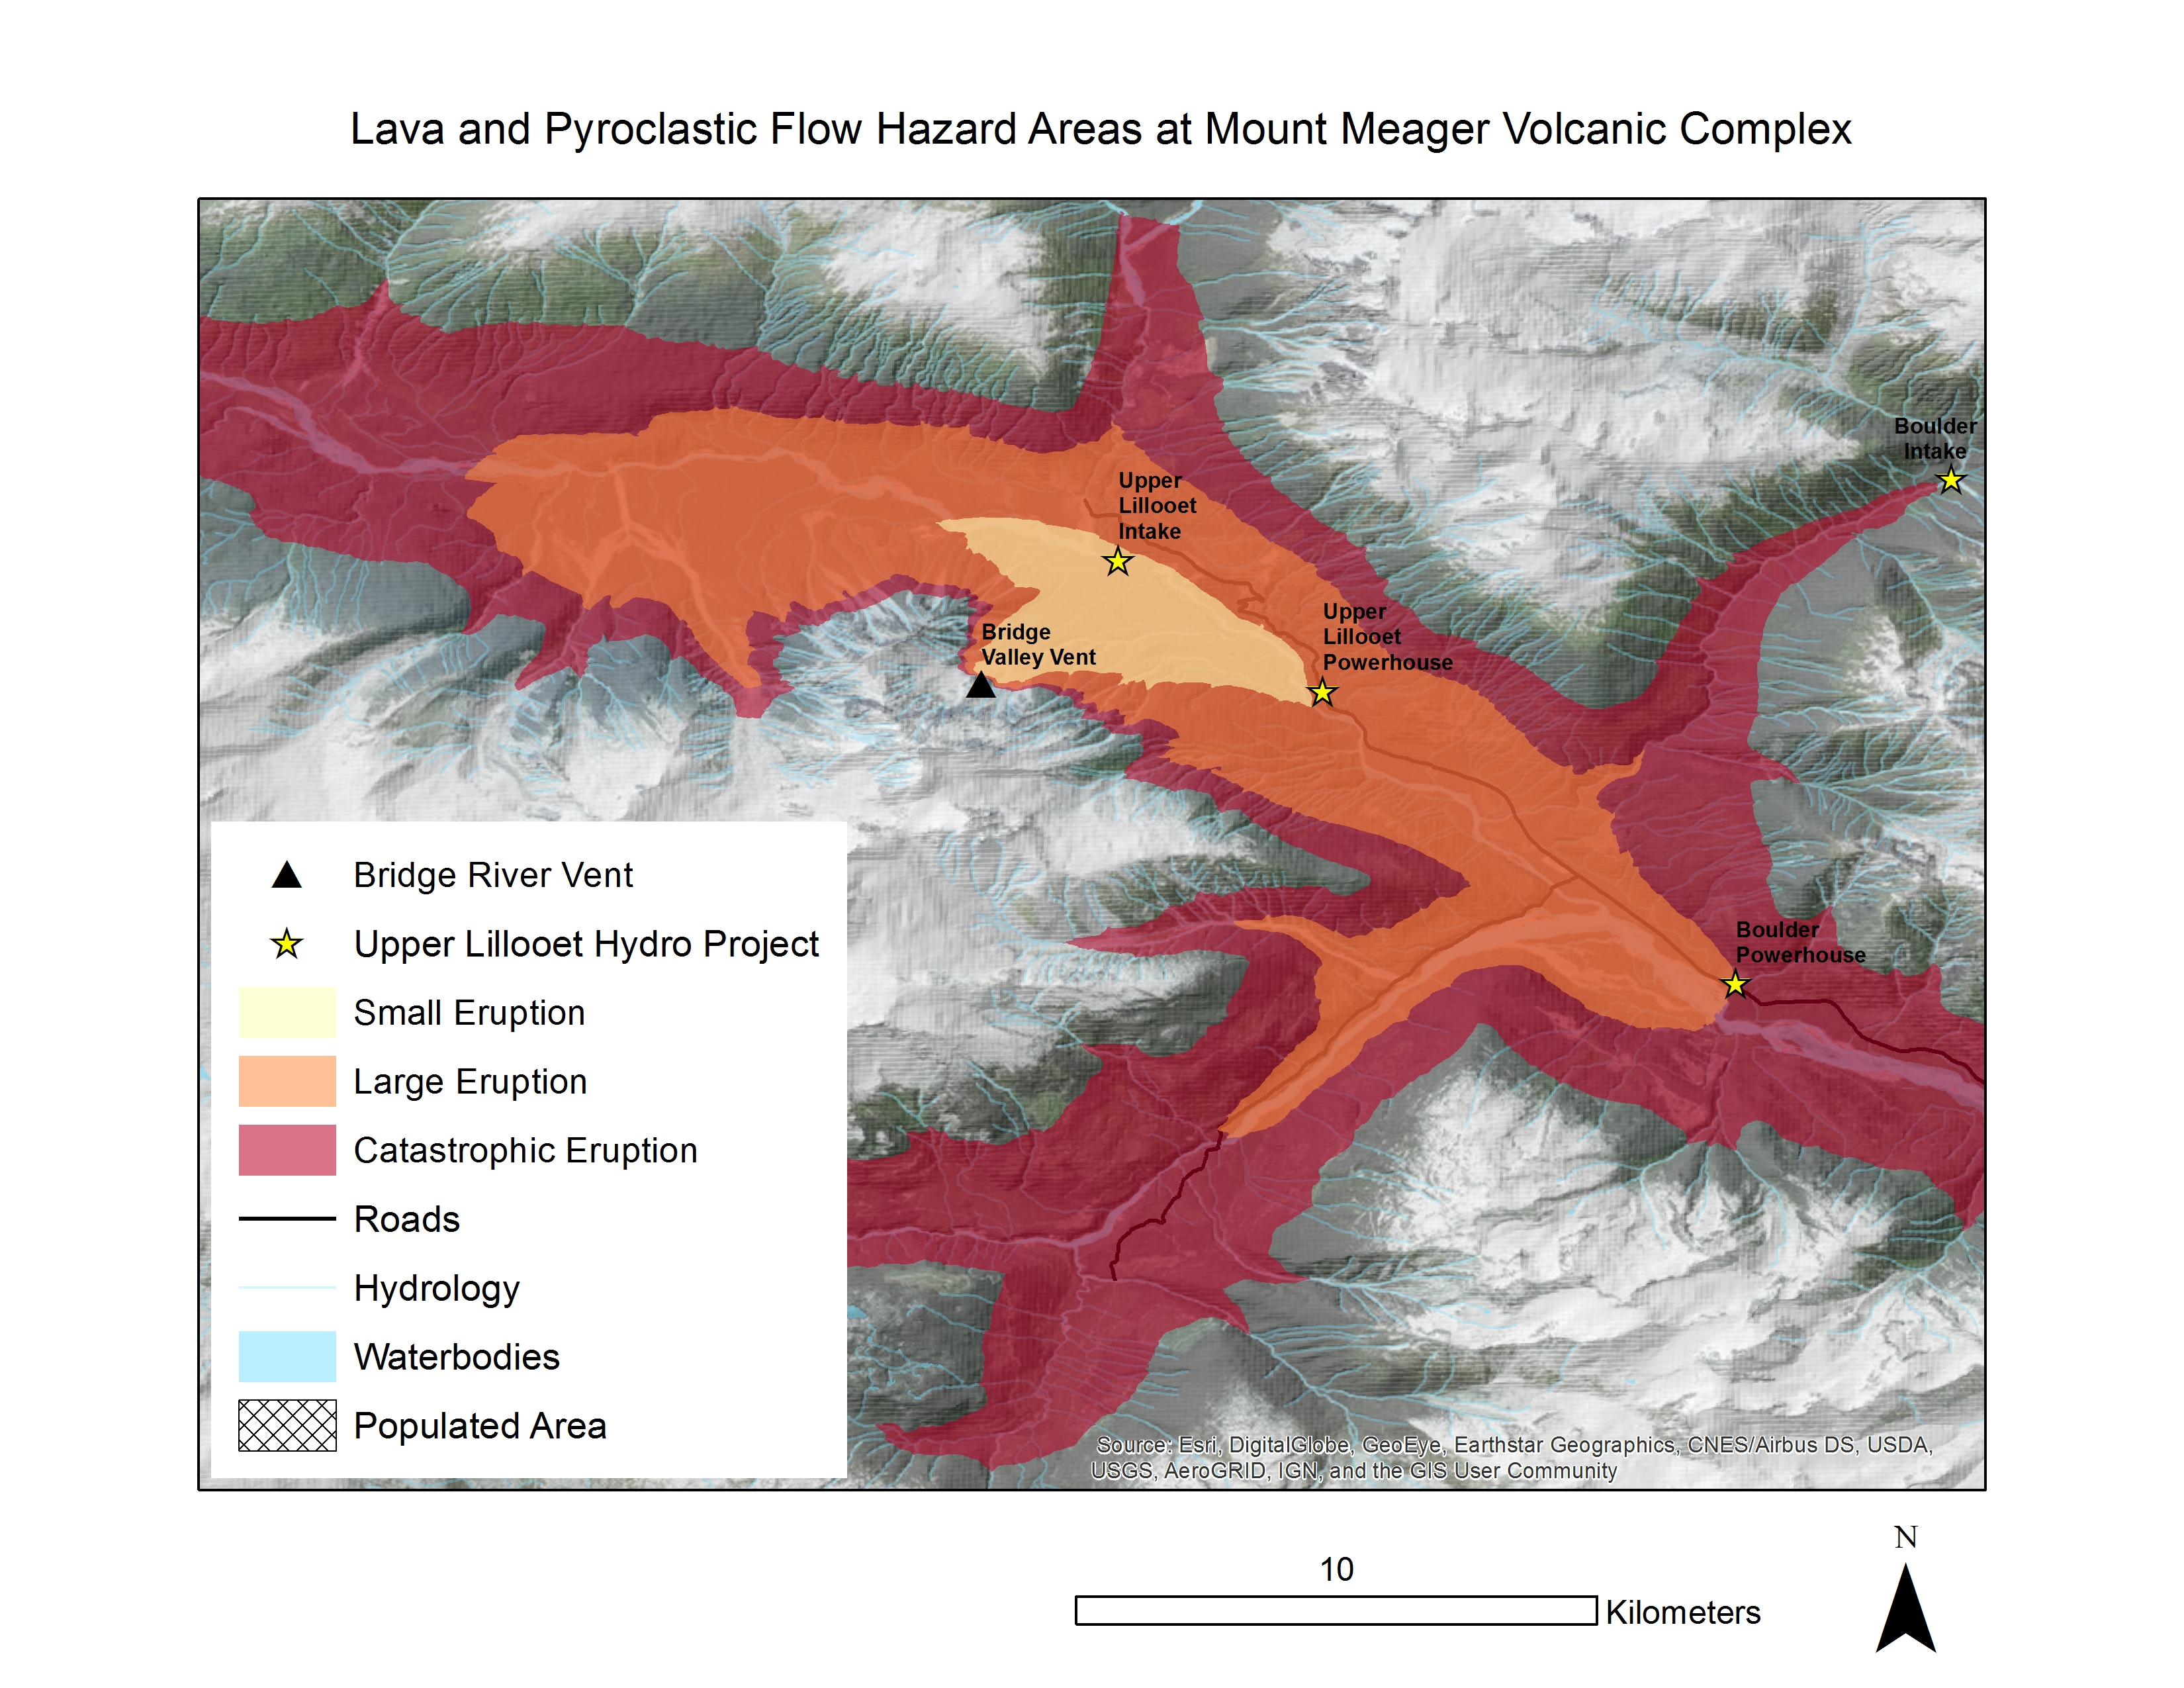
Figure 4: A close-up of lava and pyroclastic flow hazard areas at Mount Meager Volcanic Complex. Note the potential for damage to the brand new hydroelectric infrastructure even during small eruptions.
As mentioned in the opener to the Methods and Results section, although Energy Cone is not explicitly designed for modeling lavas, they were included in these analyses. Also mentioned (above) is that pyroclastic flows are the real hazard at Mt. Meager due to the nature of the eruptions. From the above map, large and catastrophic eruptions not only have the capacity to travel some ways down the valley, but up topography some ways as well. However, since the software used is not an active flow model but rather a general hazard map these results are once again uncertain. They should be used as an approximation of what could occur. Based on my trip to the area (very approximate ground truth data), it appears that the 2360 BC pyroclastic flows reached somewhere in between the simulated ‘large’ and ‘catastrophic’ eruptions.