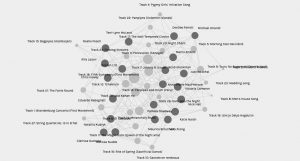
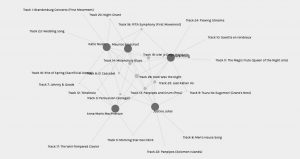
I will admit that when I loaded the data it was overwhelming at first. The web/graph of data is an interesting way to represent all the connections that exist within the data. This network represents an extensive amount of information from our previous task.
In looking at the data table of curators there were 21 individuals, who chose 10 songs from a possible 27 pieces. Now forgetting my probability calculations from the finite mathematics course I took during my undergraduate, I can’t tell you exactly but I know that would lead to a very small probability that someone would choose the exact same combination of songs. However, using the formula for combinations (where the order does not matter) we can deduce that there are 8 436 285 possible combinations.
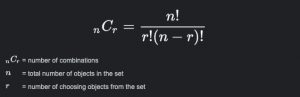
Where n = 27 songs/ r = 10 chosen songs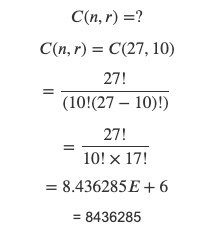
Each person has at least a few different commonalities with our peers. It makes for a good metaphor that you can find some sort of connection with anyone. In analyzing the data further, I played around with the different communities first as that was the default facet dimension.
The community I was a part of was the second one and consisted of four other people and myself – Anna-Marie MacPherson, Vera Xiong, Justine Johal, and Maurice Broschart. Maurice was the only one who shared every choice with one of us while the rest of us had 1-3 unique choices that no one in our community shared with us. Dark was the night was the only song that all 5 of us had chosen – represented by the larger node in the middle. With only their names as the main source of information, I can make the assumption that we are mostly females in our community and that our names come from different heritages. I am unable to assume age, or where they may live, or any emotional connections to the music they may have based on their personal experiences. This leads me to the part of the picture that is lacking – the reasoning behind our choices. In our own blogs for Task 8, we described the ‘why’ or our approach to choosing our 10 songs but looking at the data we can’t make those assumptions on others’ choices. There are many contributing factors to someone’s choices – gender, age, culture, religion, where they live as well as something as simple as their taste in music.
From the collective data, the largest node or most chosen was Beethovens 5th symphony and the lowest chosen were Men’s House song and Kinds of Flowers – both options I did not choose. The graph shows connections between people based on their commonalities, but how would the visualization differ based on our differences?
Thank you for sharing your ideas, Katie! I was struggling with those communities and how to interpret them, but your text actually made it clearer to me.
Best regards,
Anna
Thank you Anna! It was definitely a bit overwhelming to interpret at first but made more sense as you played around with it.