I have always been interested in the extremes of the environment because it gives us an idea of what the worse case scenario can be. I read a few articles and journals last year regarding the melting of sea ice, and most of them agreed that in the event that the ENTIRE cryosphere melted (Antarctica, Arctic, Greenland etc.), there would be an increase of 80 meters in sea level. Indeed, this is an extreme scenario, but it made me curious to see what Vancouver would look like with that rise, so I mapped it out.
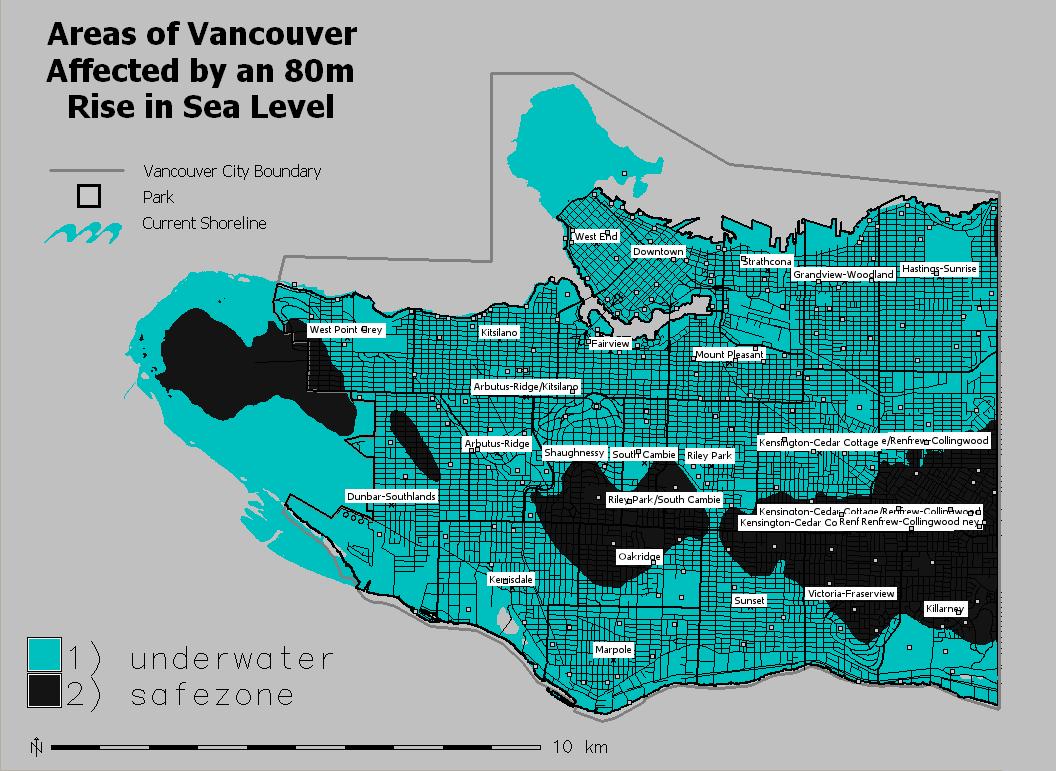
The first map shows areas of Vancouver affected by the rise. Pardon the messy labeling in the southeast corner of the map. I was still learning how to work GIS at the time. As you can see, most of the city is underwater with a few landmasses still peaking through. It is unlikely that we will experience this situation in our lifetimes, but it does indicate what our great grandchildren, and great great grandchildren and so on will have to endure.
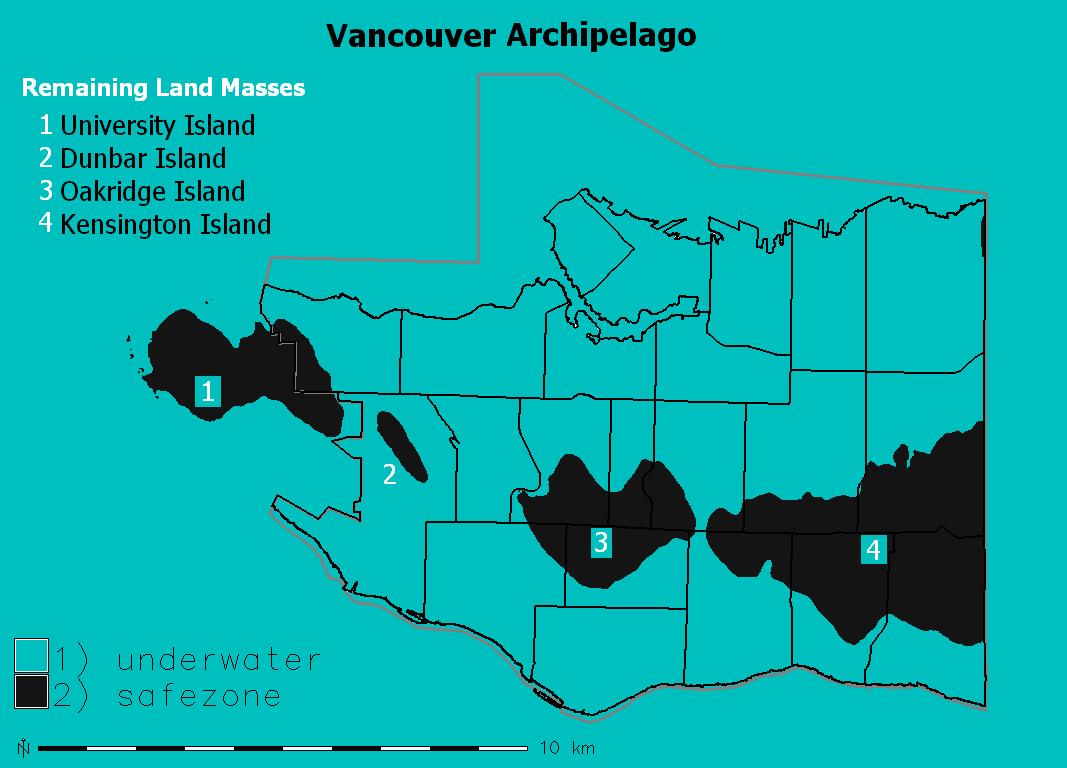
I simplified the first map to showcase my self entitled “Vancouver Archipelago”. This collection of islands will hopefully never exist for the sake of humanity and this beautiful city. To get a sense of the geography, I labeled the “islands” with corresponding neighborhoods. I want to stress that this map is displaying an extremely extreme situation sans mitigation efforts, so the challenge to comprehend the likeliness of this event was my goal in creating it. Most people do not realize the devastating effects of sea level rise, so my intention with this map was to make people question it and as you examine it, I hope you will too.