There are few reservations in leading opinions that suggest globalization has created a new paradigm of resource management with the daunting digital revolution, open door policies, trade agreements, and transnational corporations that have spread from all corners of the Earth. With a greater influence from the global north, countries that were once dependent on primitive sources of subsistence, that is agriculture, are now switching to manufacturing and production as a means of global contribution and sustenance. Globalization has been heavily examined in the scholarly community from both positive and negative viewpoints. Indeed the integration of countries through time and space compression is remarkable, but heavy western influence has its consequences. Citizens of developing countries crave a higher standard of living through the everlasting impressions western societies leave on them. They have the most to gain and the least to lose in opening their domestic markets for foreign investment. Rapid globalization is increasingly correlated with a rising standard of living in less developed countries (Griswold), which leaves disastrous footprints all over the environment. Waste generation is the exemplifier of globalization’s pitfalls in that no economic activity can succeed without leaving a long trail of waste composed of every industry thinkable. The commonality of this problem has not always been so prevalent though. It was not until the Industrial Revolution that solid waste management really geared up its efforts. Until that point in history, waste was generally composed of organic materials, mainly food waste because packaging material, e-waste, and plastics were not yet revolutionizing the world. The population was exponentially lower while the American dream was practically unattainable. Waste was generally land filled in rural areas, or openly burned to reduce volume. In some cases, recycling was practiced and composting was essentially nonexistent. The world has undergone irreversible change since those pre-industrial times and with that comes a new paradigm of waste management.
The complexity of the global waste problem can be organized using the model proposed by the European Environment Agency commonly referred to as the DPSIR framework. The purpose of this framework is to study the linkages between drivers, pressures, states, impacts, and responses of an environmental issue to provide a sound summary for policy makers to enact on (Kristensen). By unpacking the waste problem in this manner, the complexity is eased while a fuller understanding is provided. This paper will examine the magnitude of the global solid waste problem by applying the DSPIR framework to determine the potency and plethora of issues that will arise in the future. Drivers will first be analyzed to understand how solid waste management developed since the Industrial Revolution. In meeting a need comes the exertion of pressures, and in this case, it is human activities that will be discussed as the result of driving forces. As mentioned, human activities always leave a trail of evidence behind, so the condition of the environment is likely affected. With increased waste generation, waterways, soil, air, and human livelihood are all altered. This change in environmental state creates an impact on all aspects of life including but not limited to the economy, health, social relations, and happiness. As a result, people respond to the unwanted change in their environment either by mitigation or adaptation. The complexity of the waste problem lies in the linkages between these framework themes, thus they will be further examined throughout this discussion.
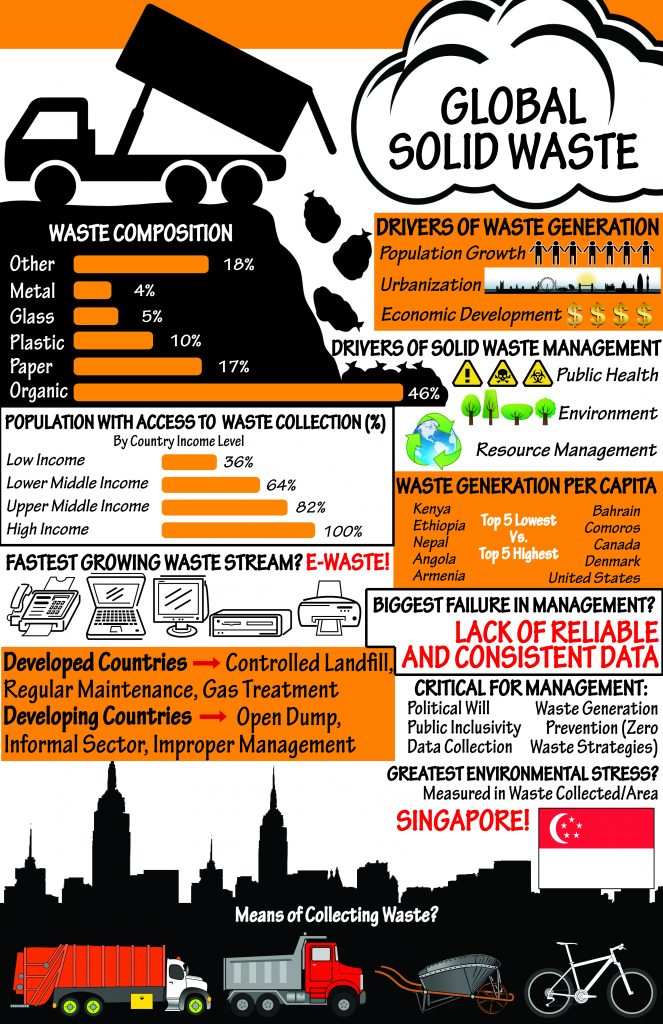
Solid waste like many other environmental or societal issues became a problem as a result of human activities. The great acceleration that rocked the Earth with exponential growth in population left behind a mountain of garbage, and a key issue that arose was that this waste had nowhere to go. Population, urbanization, and economic development in the form of industrialization are the main drivers of solid waste generation (Zhang 1623), while public health, environment, and resource management are the drivers of solid waste management (Wilson 238). Both generation and management will be specifically discussed to develop a holistic view of the problem because waste not only lies with the people who create it, but also with the people who dispose of it. Many studies will agree that the growth of population, economic development, and urbanization in the context of higher living standards are the reasons we face solid waste as a problem today. Population has surpassed seven billion people and is not expected to plateau for decades to come. Prior to the Industrial Revolution, population had not reached one billion, therefore this seven fold increase in bodies has without a doubt increased the amount of solid waste. Global integration through development and urbanization heightens waste generation with the outsourcing of manufacturing, and the physical transportation of waste from cities to less developed countries. With regards to the management drivers, public health was the first pressure to trigger management systems. Public health emerged throughout industrialization where environment and resource management arose in the late 20th century (238). This would imply that solutions have been sought for centuries without much progress.
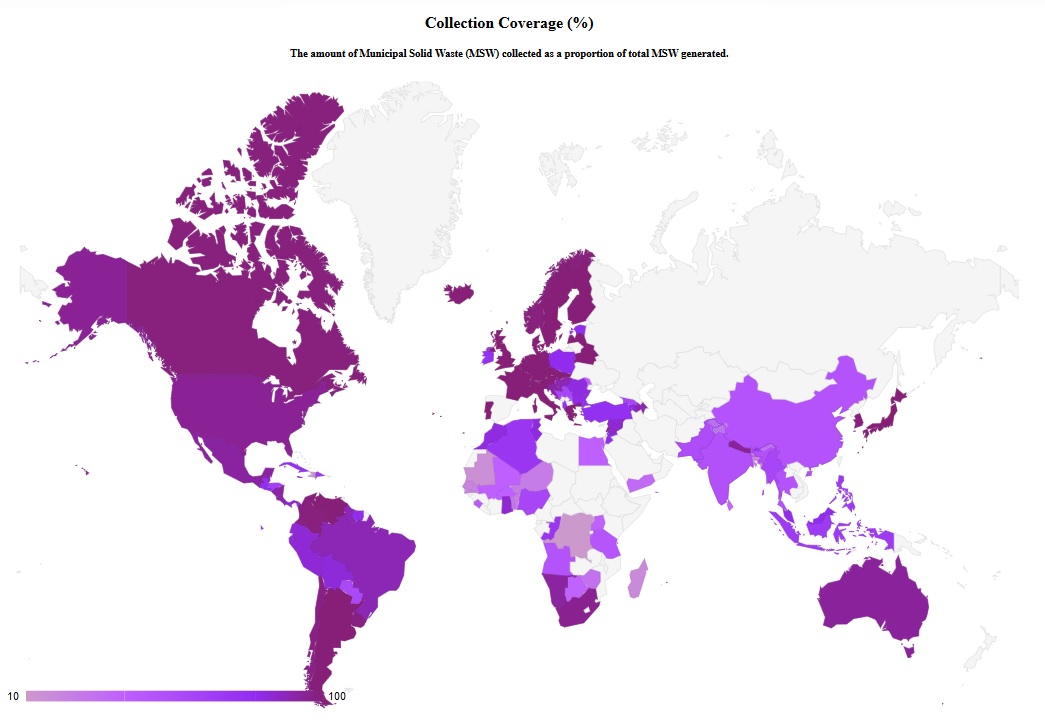
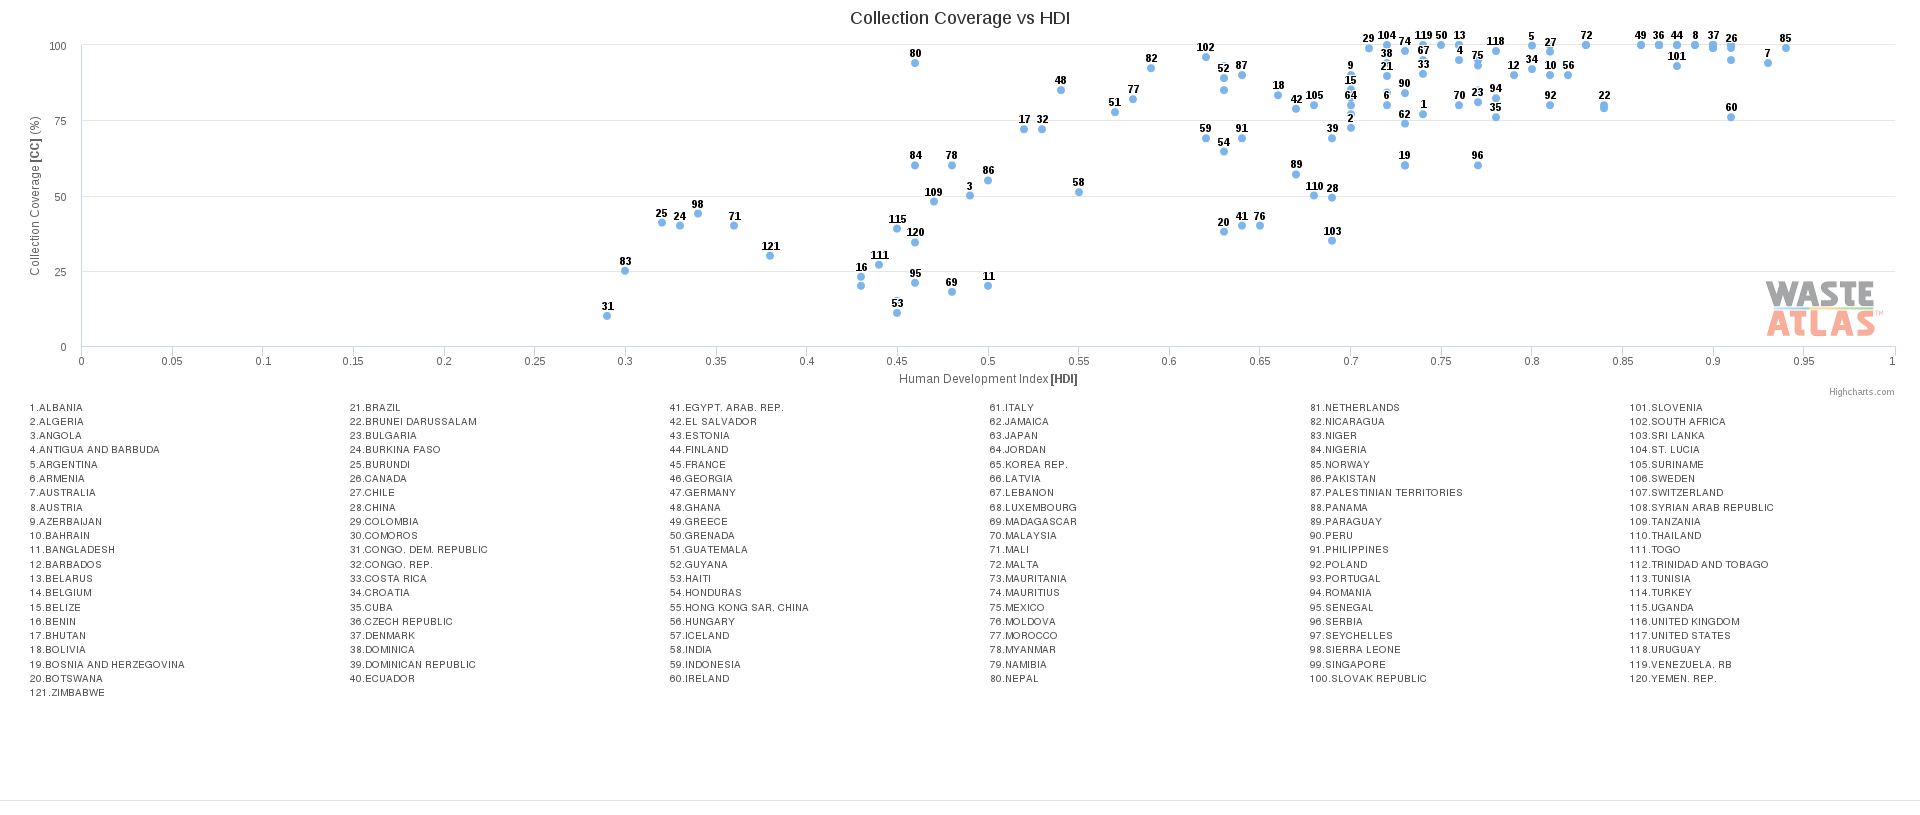
Although solid waste is a pressing issue in the modern era, the problem that has caused the most limitations to waste generation and management is the lack of reliable and consistent data available from all countries (237). It is much easier to measure drivers such as population or GDP to derive predictions on the state of solid waste, but it is nearly impossible to collect consistent data directly about waste. Every country handles waste in a different manner while some are unable to handle the waste problem at all. There are many quantitative indicators of waste management including per capita generation rate, collection rate, and proportion of population with access to collection services among others. The figures for these indicators are available in many developed countries but practically nonexistent throughout Asia and Africa where global population is concentrated.
Waste is a global issue and is not limited to the borders of cities or countries contrary to the fact that solid waste is generally municipally managed. It is necessary to collect reliable data to determine where the problem is concentrated and where management focus should be directed. It could be assumed that developing countries are waste hot spots because of the lack of financial and governmental resources, but studies have suggested that some cities in low income countries have developed sustainable waste solutions as a result of strong political commitment such as Belo Horizonte in Brazil, Quezon City in the Philippines, or the highly dense city of Kunming in China (252). This demonstrates the need for consistent data to properly assess the waste situation in all corners of the world. There are far too many discrepancies in the global waste problem when it comes to quantitative data. Consistent waste data has the potential to reflect the quality of a city management system, therefore the lack of reliable data suggests that most management jurisdictions are underperforming their role (253). It is also suggested that the lack of data in low income countries is a result of the inequality gap where the impoverished communities are not adequately managed or prioritized. Collecting these numbers is critical to approaching the global waste problem because while the science behind waste is lacking in efficiency, population, urbanization, and economic development continue to expand.
With the source of the problem identified – increasing globalization and the lack of reliable data – the next logical step is to overview what is being done to neutralize these issues in accordance to the DPSIR model. In general, waste can be disposed of in four ways: landfill, recycling, composting, and incineration. These practices vary across the world depending on infrastructure, technology available, and waste type. In meeting the needs of solid waste management, governance and funding seem to be the biggest hurdles to overcome while the entities who handle these problems are unclear. There are a variety of stakeholders who handle the growing waste problem in very different ways. Studies have sought to identify stakeholders in waste management and concluded that they range from national and local governments, to city corporations down to the individual household (Guerrero et al. 231). Waste problems have been addressed by various stakeholders as a result of pressures on the environment, land use, and emissions of chemicals into waterways, air, and soil.
Waste is mainly disposed of in landfills with high income countries, whereas open pits and illegal dumping are most common in low income countries (Wilson 247). There are high discrepancies between waste management strategies in developed and developing countries where different stakeholders dominate. The informal sector collects municipal solid waste without being financed or recognized by the formal sector, deeming them illegitimate (242). These groups are entirely market driven meaning they collect waste, separate it, and sell it as a means of subsistence. This practice of door to door recovery is very common in developing countries where access to waste collection is low as a result of little government initiative (Zhang et al. 1626). In countries with large inequality gaps, it is expected that the informal sector will dominate. In China, there are double the amount of people practicing in the informal sector as there are in the formal, where the concentration of the waste pickers lies on the west side of the country (1628). This is evident when wealth distribution is considered throughout the nation. The bulk of China’s major metropolitans and business centers are concentrated along the east coast of the country which in turn, is directly correlated with the efficiency of waste collection services by the formal sector (1628). China is a significant force in studying waste management considering they house the greatest population globally, and are growing exponentially in economic development deeming them invincible when it comes to waste generation. The weight of management that policy makers have to carry is in this case, of great importance.
The increase of human intervention leaves the environment irreversibly changed raising new problems for micro and macro management systems. Each method of disposal leaves unwanted change on the biosphere. Since there is no universal formula for the placement of landfills, incinerators or recycling plants, the effects from disposal sites are wide ranging depending on the surrounding environment. Although they are generally constructed away from residential areas to reduce the impact of noise, air and odor pollution, there are still exceptions to this convention in many parts of the undeveloped world. With landfills, their placement could include factors of convenience, land use, or environmental protection depending on the governing body. In developed countries, landfills are typically engineered to mitigate environmental impacts. For example, the barrier between the waste and soil pit is necessary to drain leachate from the landfill. Leachate is the leftover water contents of solid waste which has the potential to worsen with poor weather conditions, which is why landfills are typically covered. It drains to the bottom of the landfill and without a membrane to shield the soil, it will seep through the soil layers. This can negatively affect biodiversity, soil fertility, and groundwater supply (Zhang et al. 1629). Materials that contain high moisture content is most commonly organic waste, so it is suggested that the increase in food waste will have detrimental impacts on the environment (Song et al. 202-203). Depending on the disposal method and waste composition, various spheres of the environment are effected. Landfills in North America would have different impacts than landfills in Asia or Africa because of waste composition. In developing countries where the bulk of waste is composed of organic materials, air pollution also becomes a problem along with the leachate issues. It is mainly food waste that is being disposed of when organic composition is high and when organic waste decomposes anaerobically, that is without oxygen, methane is emitted (203). Biogas is treated in state of the art landfills, but since developing countries lack the technology and funds to treat methane gas, it is often uncontained. In the United States, landfill gas contributes 17% of the total methane emitted. Methane gas is environmentally lethal being more than 25 times as potent as carbon dioxide (203); the greatest contributor to global warming. Organic waste in landfills alone contributes to climate change, air pollution, soil degradation, human and animal health, and groundwater pollution as noted in the example of leachate. As a result, the state of the Earth is altered creating new challenges for policy makers. This raises questions as to what effect organic waste might have on the environment when it is burned, recycled or composted. Or to deepen the understanding of landfills, what would happen if plastics and packaging materials were to dominate landfill composition like it does in North America and Europe?
These seemingly endless issues need proper management and strategic action to minimize the stress on the biosphere. Once the state of the Earth is modified and the impacts on the environment, economy, and humanity are felt, authorities will finally address the problems. It must be noted that efficient waste management is not a simple task for policy makers. Waste management is largely interdisciplinary with performance factors involving technology, environment, finance, law, and institutional frameworks among many (Guerrero et al. 221). It is suggested that local and national governments are the most important actor because they have the power to implement regulations in addition to provisioning them (223), but it has also been argued that sustainable solid waste management needs to be decentralized to encompass all participants (Zhang et al. 1631). This would imply that citizens are equally important in the waste management system. Studies show that waste separation is noticeably better when participants are involved in the decision making process (Guerrero et al. 224). In theory, this appears to be a simple task but addressing the issue of waste diversion to every household that has access to waste collection is problematic. Similar to the governing body’s attitude on waste, citizens must also demonstrate interest in waste management in order to participate effectively. Support and infrastructure are the two loaded problems of waste collection, transfer and transport (225). Support is needed from all branches of stakeholders including governments, municipal leaders, service users, and service providers. If there is no unity among these stakeholders with their views on waste management, progress will be delayed. In addition to support, infrastructure in the form of roads and equipment are needed to boost efficiency. Without these structures to back waste management, it is likely that people will take disposal into their own control meaning there will be an increase in illegal dumping and open burning of combustible materials especially in the global south.
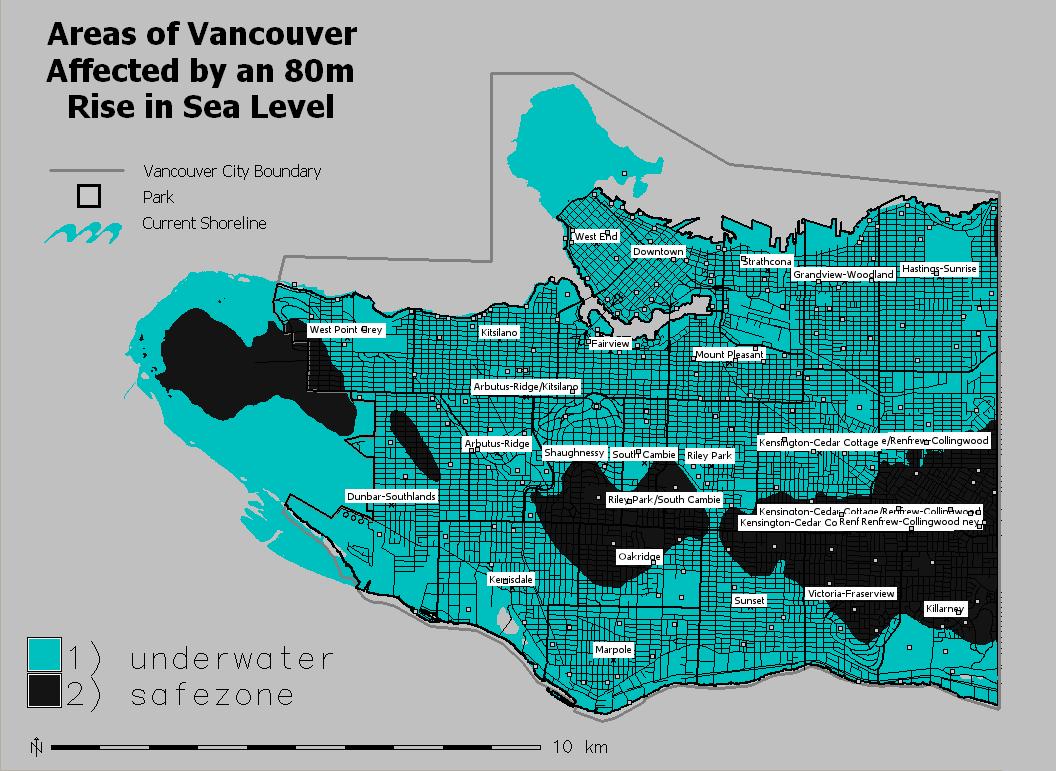
To counter the increasing waste generation, the concept of zero waste has been widely adopted to promote recycling and product redesign (Song et al. 199). The theory being that material flow is circular with no components being sent to landfills or incinerators makes this concept appear utopian. Although the practice has been implemented in a number of countries, cities and companies with exceptional results, zero waste has not yet become mainstream. A few examples of zero waste adopters include the cities of Adelaide, Australia, and San Francisco, California, as well as companies like Coca Cola and Subaru US (204). All these corporations have made considerable efforts to minimize their waste generation either by the implementation of policy, reducing packaging waste, or recycling materials. Vancouver has also demonstrated progress in their goal of zero waste by 2020. Most recent data shows that the city has diverted 23% of waste from landfills or incinerators; nearly the halfway point of their goal to reduce waste disposal by 50% from 2008 levels (Zero Waste). Although efforts are being made, the timeline is troubling and at this point in the Greenest City Plan, it is unlikely that waste diversion will meet the nearing deadline. Regardless, this is a remarkable improvement compared to many other cities or countries who have not adopted any waste goals.
Zero waste principles suggest that the greatest means of reducing waste is to not produce it at all. This is called waste prevention or source reduction (Song et al. 208). It works to utilize goods that are not hindered by planned obsolescence. In purchasing durable goods that are minimally packaged, recycling and reusing are easier practices. To achieve zero waste, efforts must surpass recycling, and address the need to prevent waste from being produced altogether. The main goal of implementing this seemingly impossible concept is to trigger lifestyle change and appreciation for nature. Through these changes in behavior, it is possible to reduce solid waste from entering our landfills and poisoning the ecosystem that is meant to support us.
Although the problem seems to be worsening in many parts of the world, there is still a glimmer of hope for those who want to succeed. For this to happen, the key issues of population growth, globalization, and good governance must be addressed to effectively mitigate the global waste problem. Policymakers and municipal authorities are encouraged to study these issues in relation to waste management to develop new and reliable data. Effective strategy lies in the relationship between citizens and power structures where cooperation on decision making is critical. The global waste problem cannot be addressed simply by implementing western technologies in developing countries. Waste management is dependent upon the suitability of technology, the financial ability of the local government, and the knowledge that exists on waste systems (Wilson et al. 263). Solutions must be custom made to complement local cultures and traditions. An example of this practice can be demonstrated with the informal sector. There is future potential for the informal sector to coalesce with the government to boost waste collection and save money on expenditures simultaneously. Since these waste pickers are entirely market driven, it is possible that in recognizing their efforts, governments can save money on their waste budgets. With waste being recycled into the local economy, governments do not have to spend as much on final disposal. Studies show that the informal sector has helped some less developed countries save more than 20% of their waste management budget (249). Surely, this practice could spread to other municipalities and governing authorities.
The future for solid waste management depends entirely on policy changes. These changes encompass new regulations, implementation of action plans like zero waste, and the incorporation of public opinion on waste solutions. In meeting the needs of a complicated management system, it is probable that new issues will arise but real change cannot be felt without some sacrifices in urban growth and economic development. Luckily, there are organizational frameworks like the DPSIR model that reinforce connections between different components of environmental issues. These linkages help to clarify the confusion that surrounds socioeconomic and sociocultural setbacks like waste management. Indeed, there is a long road ahead of us but these challenges must be dealt with in order to avoid being buried alive in garbage.
Works Cited
Griswold, Daniel. “The Blessings and Challenges of Globalization.” CATO Institute, 1 Sept. 2000, https://www.cato.org/publications/commentary/blessings-challenges-globalization. Accessed 21 Nov. 2016.
Guerrero, Lilliana A., et al. “Solid Waste Management Challenged for Cities in Developing Countries.” Waste Management, vol. 33, no. 1, Jan. 2013, pp. 220-32, dx.doi.org/10.1016/j.wasman.2012.09.008, Accessed 21 Nov. 2016.
Kristensen, Peter. “The DPSIR Framework.” National Environmental Research Institute, Denmark, Sept. 2004, http://wwz.ifremer.fr/dce/content/download/69291/913220/file/DPSIR.pdf. Accessed 21 Nov. 2016.
Song, Qingbin, et al. “Minimizing the Increasing Solid Waste Through Zero Waste Strategy.” Journal of Cleaner Production, vol. 104, Oct. 2015, pp. 199-210, dx.doi.org/10.1016/j.jclepro.2014.08.027, Accessed 21 Nov. 2016.
Wilson, David C., et al. “Comparative Analysis of Solid Waste Management in 20 Cities.” Waste Management & Research, vol. 30, no. 3, Mar. 2012, pp. 237-54, doi: 10.1177/073424X12437569, Accessed 21 Nov. 2016.
“Zero Waste.” City of Vancouver, 2016, http://vancouver.ca/green-vancouver/zero-waste.aspx. Accessed 21 Nov. 2016.
Zhang, Dong Q., et al. “Municipal Solid Waste Management in China: Status, Problems, and Challenges.” Journal of Environmental Management, vol. 91, no. 8, Aug. 2010, pp. 1623-33, dx.doi.org/10.1016/j.jenvman.2010.03.012, Accessed 21 Nov. 2016.