Overview:
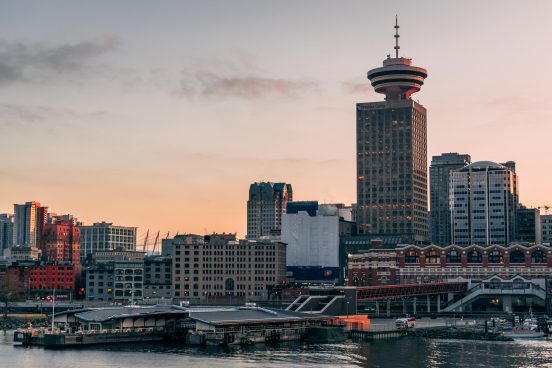
A storm surge, tidal surge or storm tide is a coastal flood or tsunami like phenomenon of rising water commonly associated with low-pressure weather systems, such as cyclones. It is measured as the rise in water level above the normal tidal level (cite). Although the height, speed and inland reach of a storm surge and resultant flooding depends on various factors (winds, tides, inland waterways), this project is simplified to the immediate danger zone – classified as, low elevation areas at, or below, 10 meters that lie up to 1 kilometer inland from the shoreline. This project’s focus location is Metro Vancouver.
Objectives:
- Create an overview map of Metro Vancouver’s areas of potential storm surge flooding – elevations of 0 – 10 meters, colour coded by elevation height. Done in layout view with associated map elements such as legends, scale bars and title.
- Map of potential flooding, refined analysis of potential storm surge by identifying areas of potential flooding by elevation within 1 km of shoreline.
- Map of all roads affected by potential flooding, colour coded by type, with a table on the map summarizing road type by total length.
- False Creek tidal flats area detail map: A finer resolution elevation map, map of school facilities and the new St.Paul’s hospital location that could be affected by potential flooding.
Summary:
This lab was based around a potential storm surge event in Metro Vancouver. Immediate danger zones are regions of low elevation (below 1 km up into 1 km inland from the shoreline). This lab is broken down into four parts – Classifying raster data to show regions of low elevation, creating a potential storm surge map flood map, creating a map of roads and highways that could potentially be affected by a flooding event and looking into the development of False Creek.
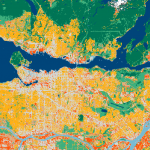
Map 1: Low Elevation
The first part of the lab consisted of figuring out elevation for the city of Vancouver. Regions of high elevations are denoted by the colour yellow (areas such as the North Shore Mountains) and areas of low elevation in dark blue – blue (Richmond, Delta). The resolution for the DEM data is 25,25
Map 2: Flooding Buffer
The second map highlights regions are below 8 meters and 1 km inland from the shoreline. Areas by the Fraser River are at high risk for flooding events.
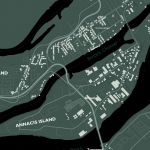
Map 3: Road Flooding
This map shows major roads, highways and expressways that would be affected by a potential storm surge. A table at the bottom of the map highlights each road type and the lengths of each type that would be affected
Map 4: False Creek and St.Paul’s Hospital
A new DEM resolution was used. This DEM was located around False Creek and the resolution is much finer (1,1). Majority of False Creek falls under into the risk zone, but it is an area of high development. The New St.Paul’s Hospital (marked by the polygon) is set to be built. A key facility in a risk zone could be a problem in the future