Overview:
Alaskan Pollock is a key species in the Alaska groundfish complex and a target species for one of the world’s largest fisheries¹. Pollock is a semi-pelagic schooling fish widely distributed in the North Pacific Ocean with largest concentrations in the eastern Bering Sea¹. Although target populations for the species are at recommended levels, science-based management and monitoring is still necessary to ensure that fish stocks can remain healthy and productive.
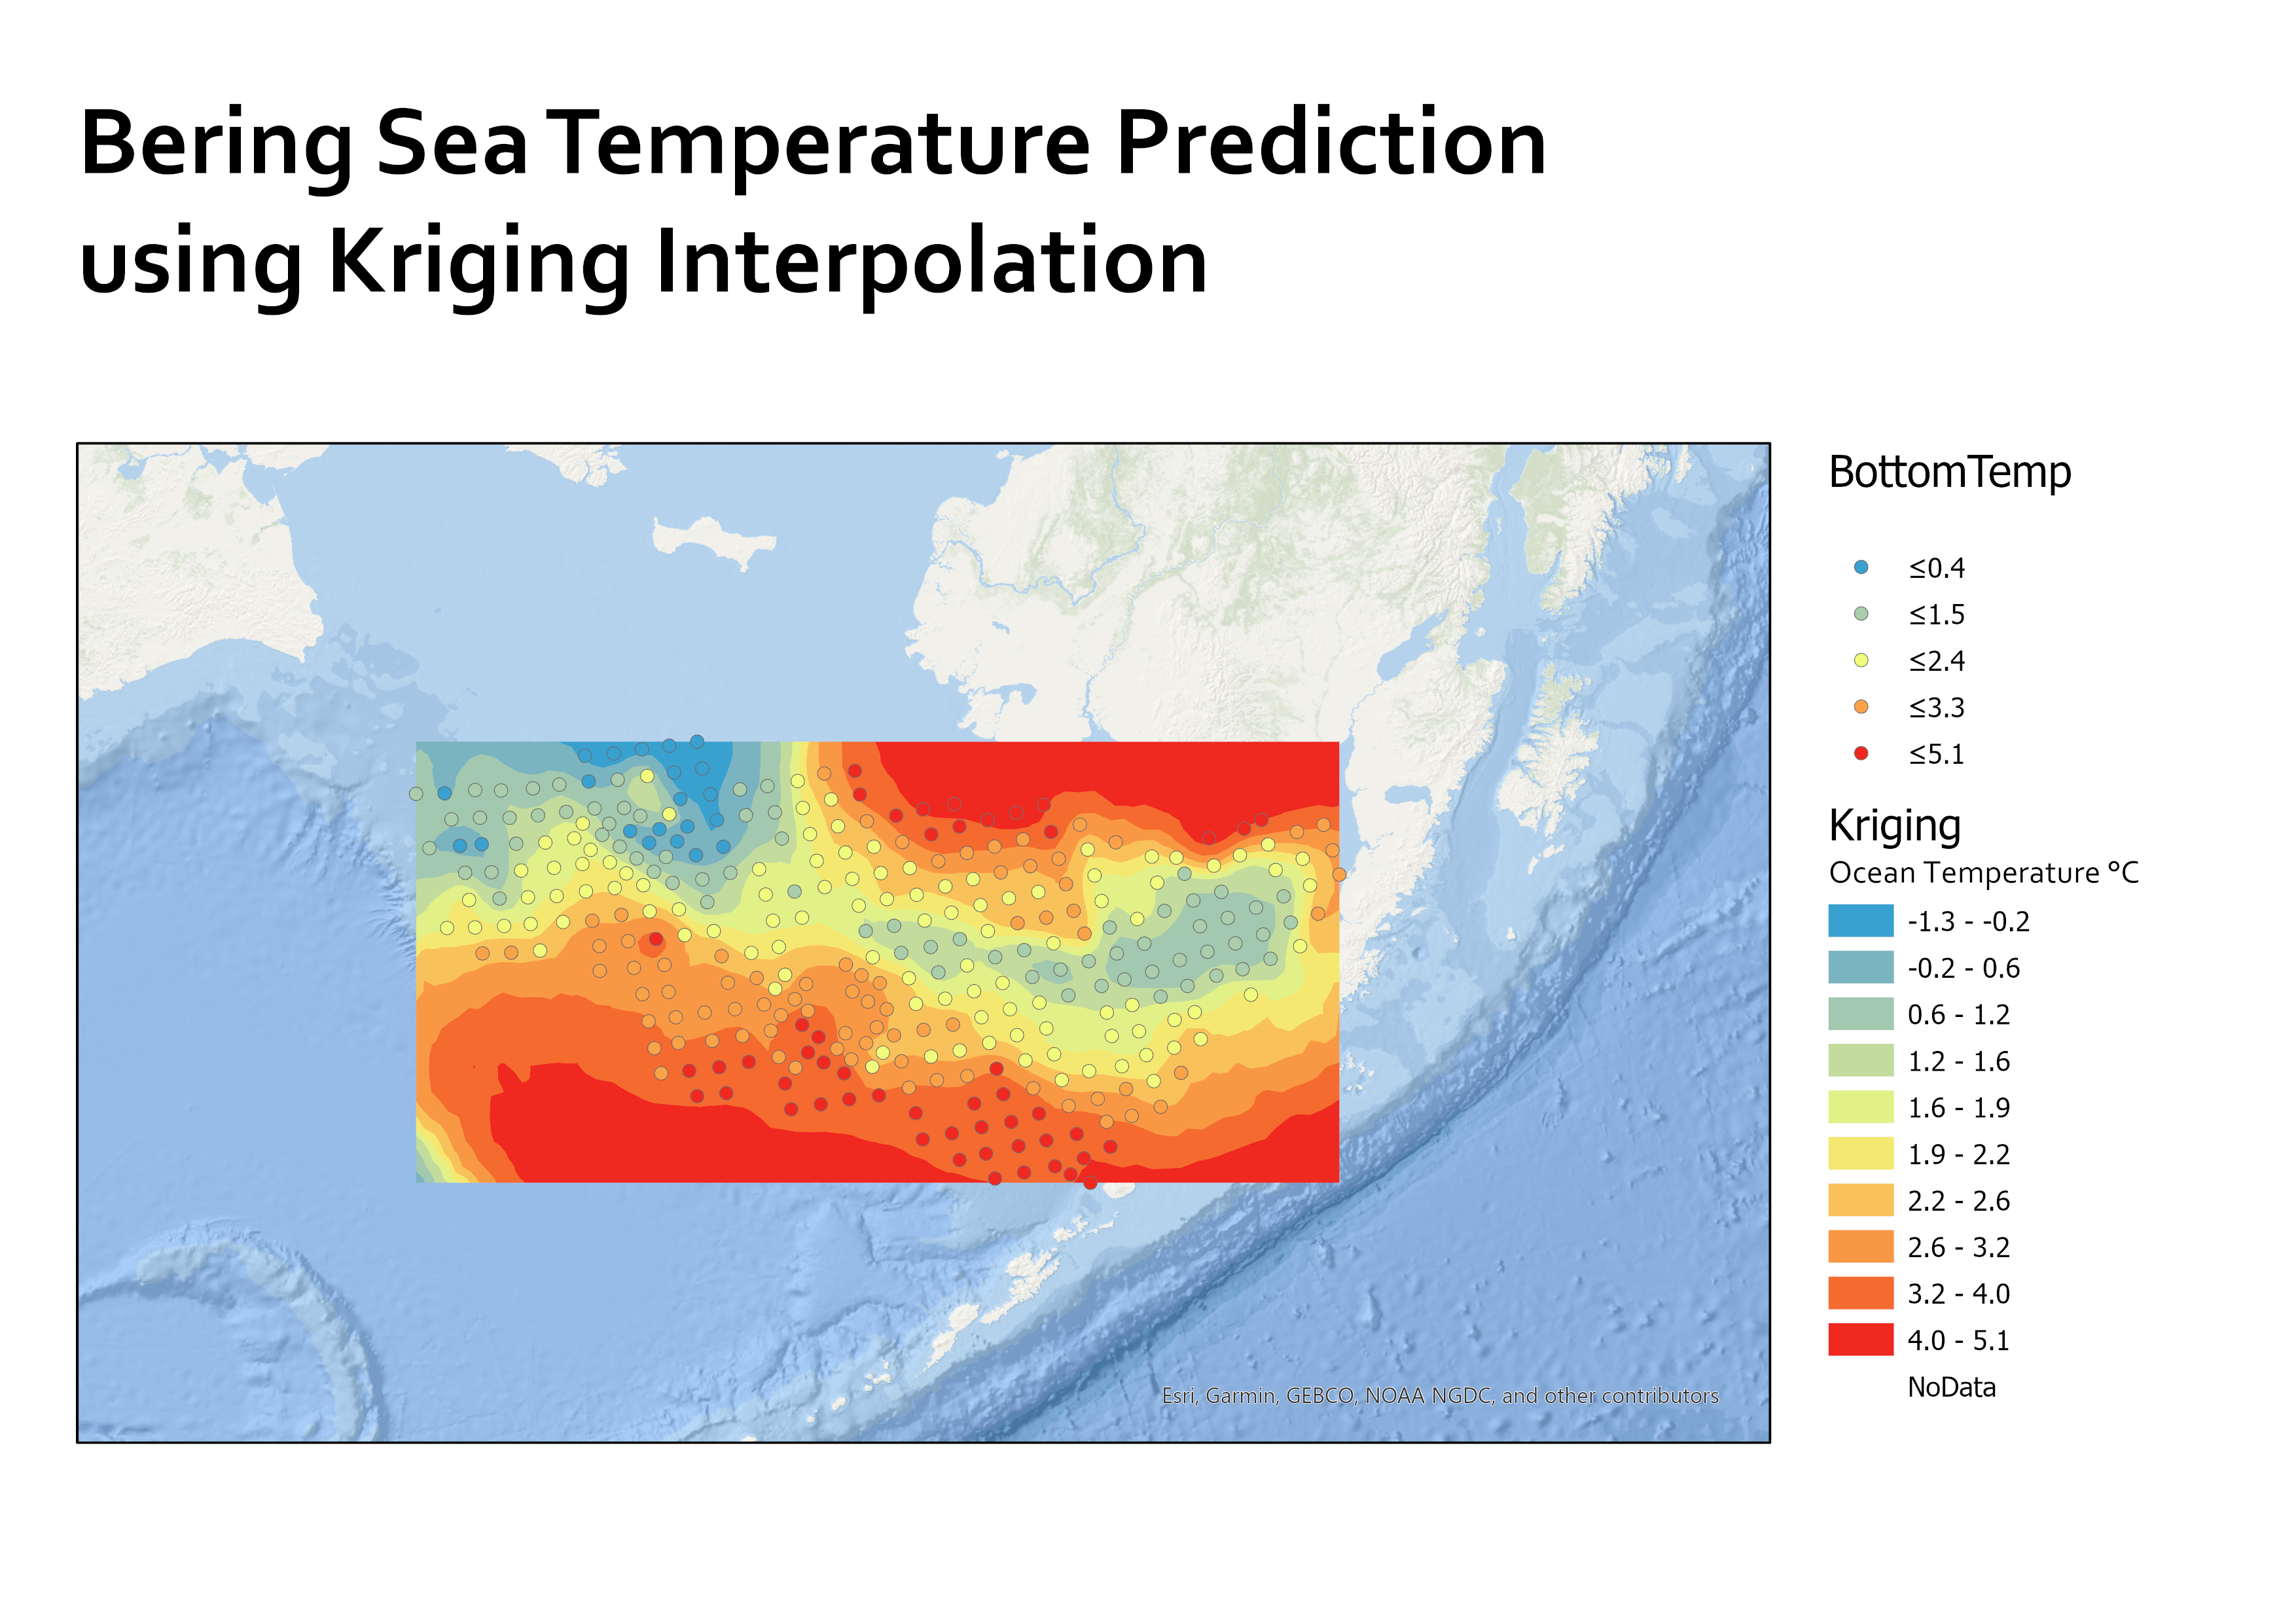
In order to optimize fishing practices, vessels needs to be able to look in the right places, i.e – wasting time fishing in empty seas or overfishing in productive areas. In order to fish both efficiently and sustainably, it is important to understand where shoals are most likely to be located. Concentration of adult Alaskan Pollock in the Bering Sea are usually found in water temperatures between 2° – 4°C². By using geostatistics to temperature data, predictions can be made to locate viable shoals.
This short project is a guided lesson from ESRI which looks at some of the interpolation methods available in ArcGIS Geostatistical Analyst. These methods will allow for ocean temperature prediction continuously across the study area using discrete temperature measurements.
Objectives:
- Map ocean bottom temperatures in the Bering Sea using the Geostatistical Wizard in ArcGIS Pro.
- Build prediction surfaces using polynomial, inverse distance weighting and kriging interpolation methods.
- Compare cross-validation errors for different surfaces to determine which is the most accurate
Summary:
There are many different interpolation methods available through the Geostatistical Wizard. In this project, ocean temperatures were predicted using
- global polynomial interpolation which is a quick deterministic interpolation method that is smooth (inexact). Best used to see the general trend of a data set³.
- local polynomial interpolation which is more flexible than the global polynomial method with more parameter decision that have to be made4.
- inverse distance weighting is an interpolation method that is considered to be fast and automatic. Explicitly makes the assumption that the things that are close to one another are more alike that those that are farther apart5.
- kriging assumes that at least some of the spatial variation observed in natural phenomena can be modelled by random processes6.
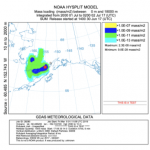
Four different prediction surfaces were created using four different methods. To compare the four, cross validation is used. Cross validation is a report on the accuracy of a surface. The closer the reference line (grey) to the regression line (blue) is, the better the match of the predicted values. In this case, kriging was the best scatterplot (Fig 1)
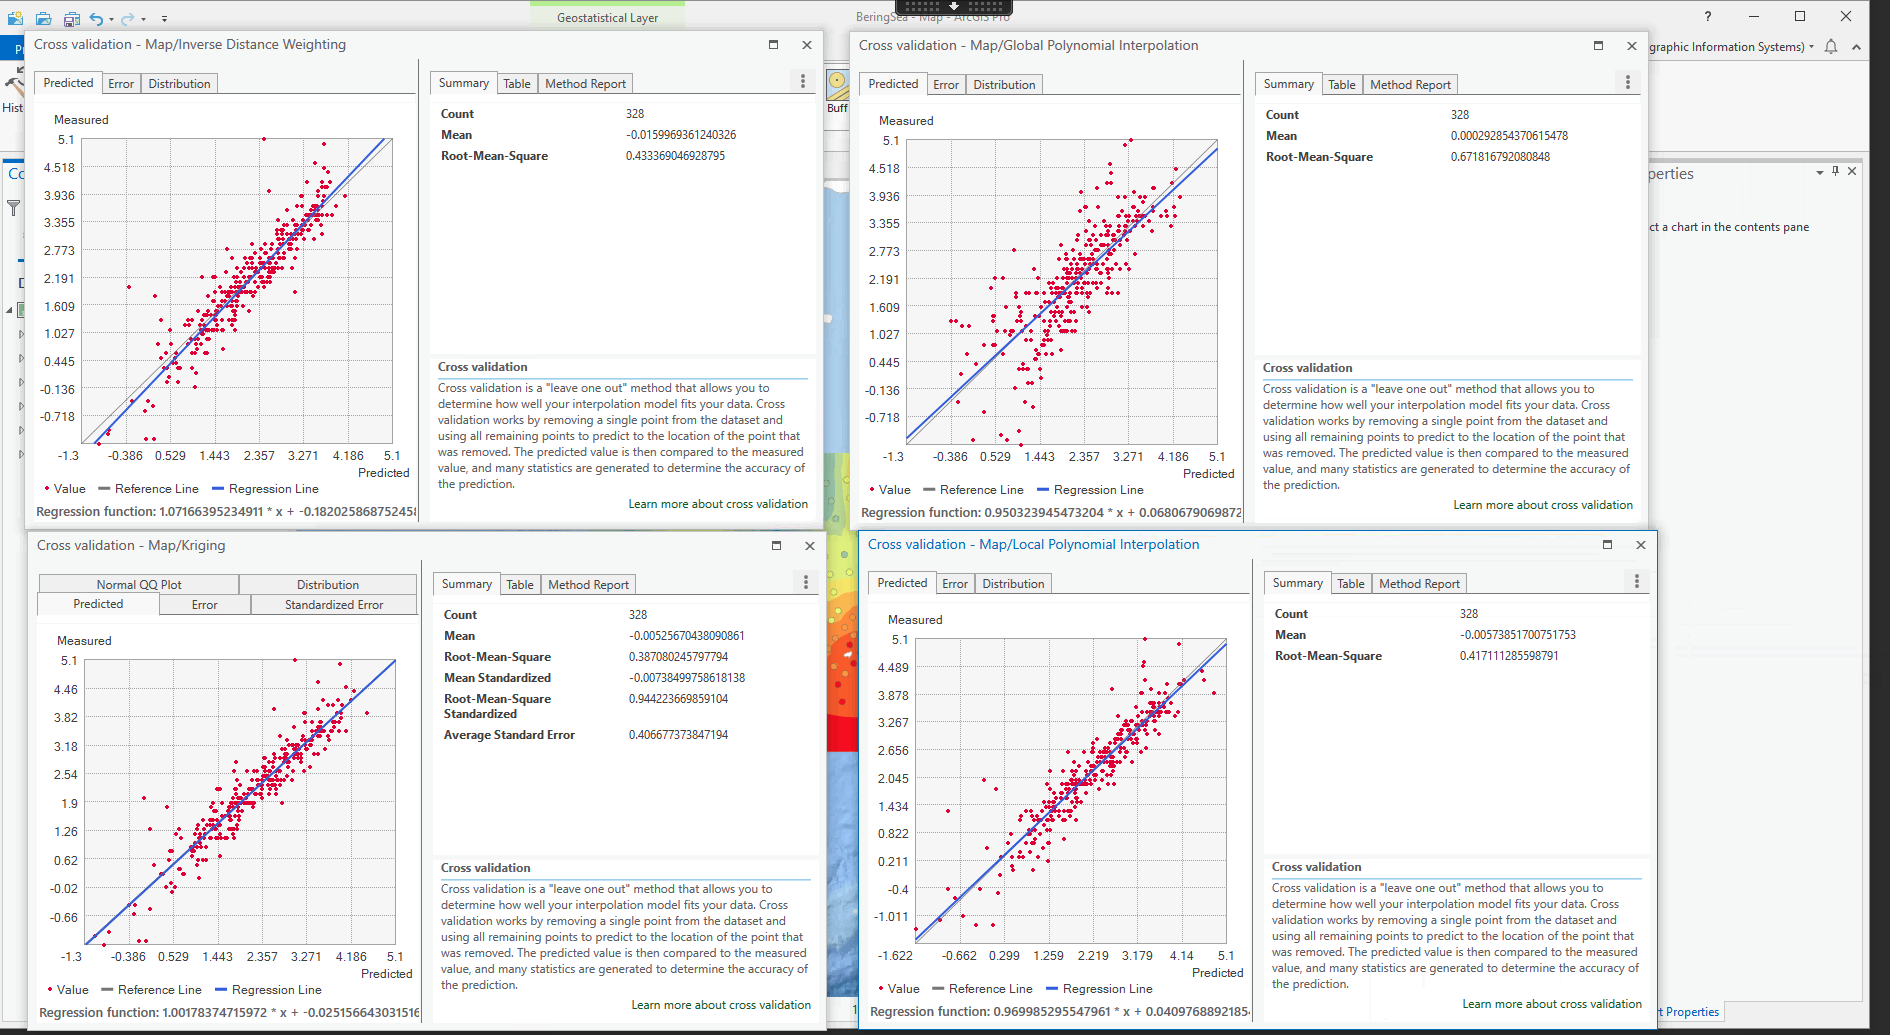
The Root-Mean-Square (RMS) value is calculated for all interpolation methods. The ideal value for RMS is zero, but how close it should be to zero depends on the unit – in this case, degrees Celsius. All the models produced good RMS error values, but kriging produced the best one.
While there are many different interpolation methods available in the Geostatistical Wizard, it is important to try many different methods and parameters to find the best fit. A more accurate knowledge of fish distribution is only one of the pieces necessary for improving sustainable fishing practices. Observation of fish behaviour, modifications of fishing practices (e.g. reducing bycatch) and other studies can help plan for sustainable fishing management and healthy fish stocks.
References:
- https://www.fisheries.noaa.gov/species/alaska-pollock
- https://www.adfg.alaska.gov/index.cfm?adfg=walleyepollock.main
- https://pro.arcgis.com/en/pro-app/latest/help/analysis/geostatistical-analyst/how-global-polynomial-interpolation-works.htm
- https://pro.arcgis.com/en/pro-app/latest/help/analysis/geostatistical-analyst/how-local-polynomial-interpolation-works.htm
- https://pro.arcgis.com/en/pro-app/latest/help/analysis/geostatistical-analyst/how-inverse-distance-weighted-interpolation-works.htm
- https://pro.arcgis.com/en/pro-app/latest/help/analysis/geostatistical-analyst/kriging-in-geostatistical-analyst.htm