Despite the imprecision involved in data transformations, the rescaled layers seemed a fairly accurate representation of desired scoring, as established by randomized spot checks to compare original value and post-transformation score. Additionally, the bus density analysis (Figure 1) provided an early understanding of the shape of Metro’s existing bus system and the distribution of service throughout the region. As expected, service is most densely concentrated in the downtown core, with corridors of density expanding out into surrounding regions.
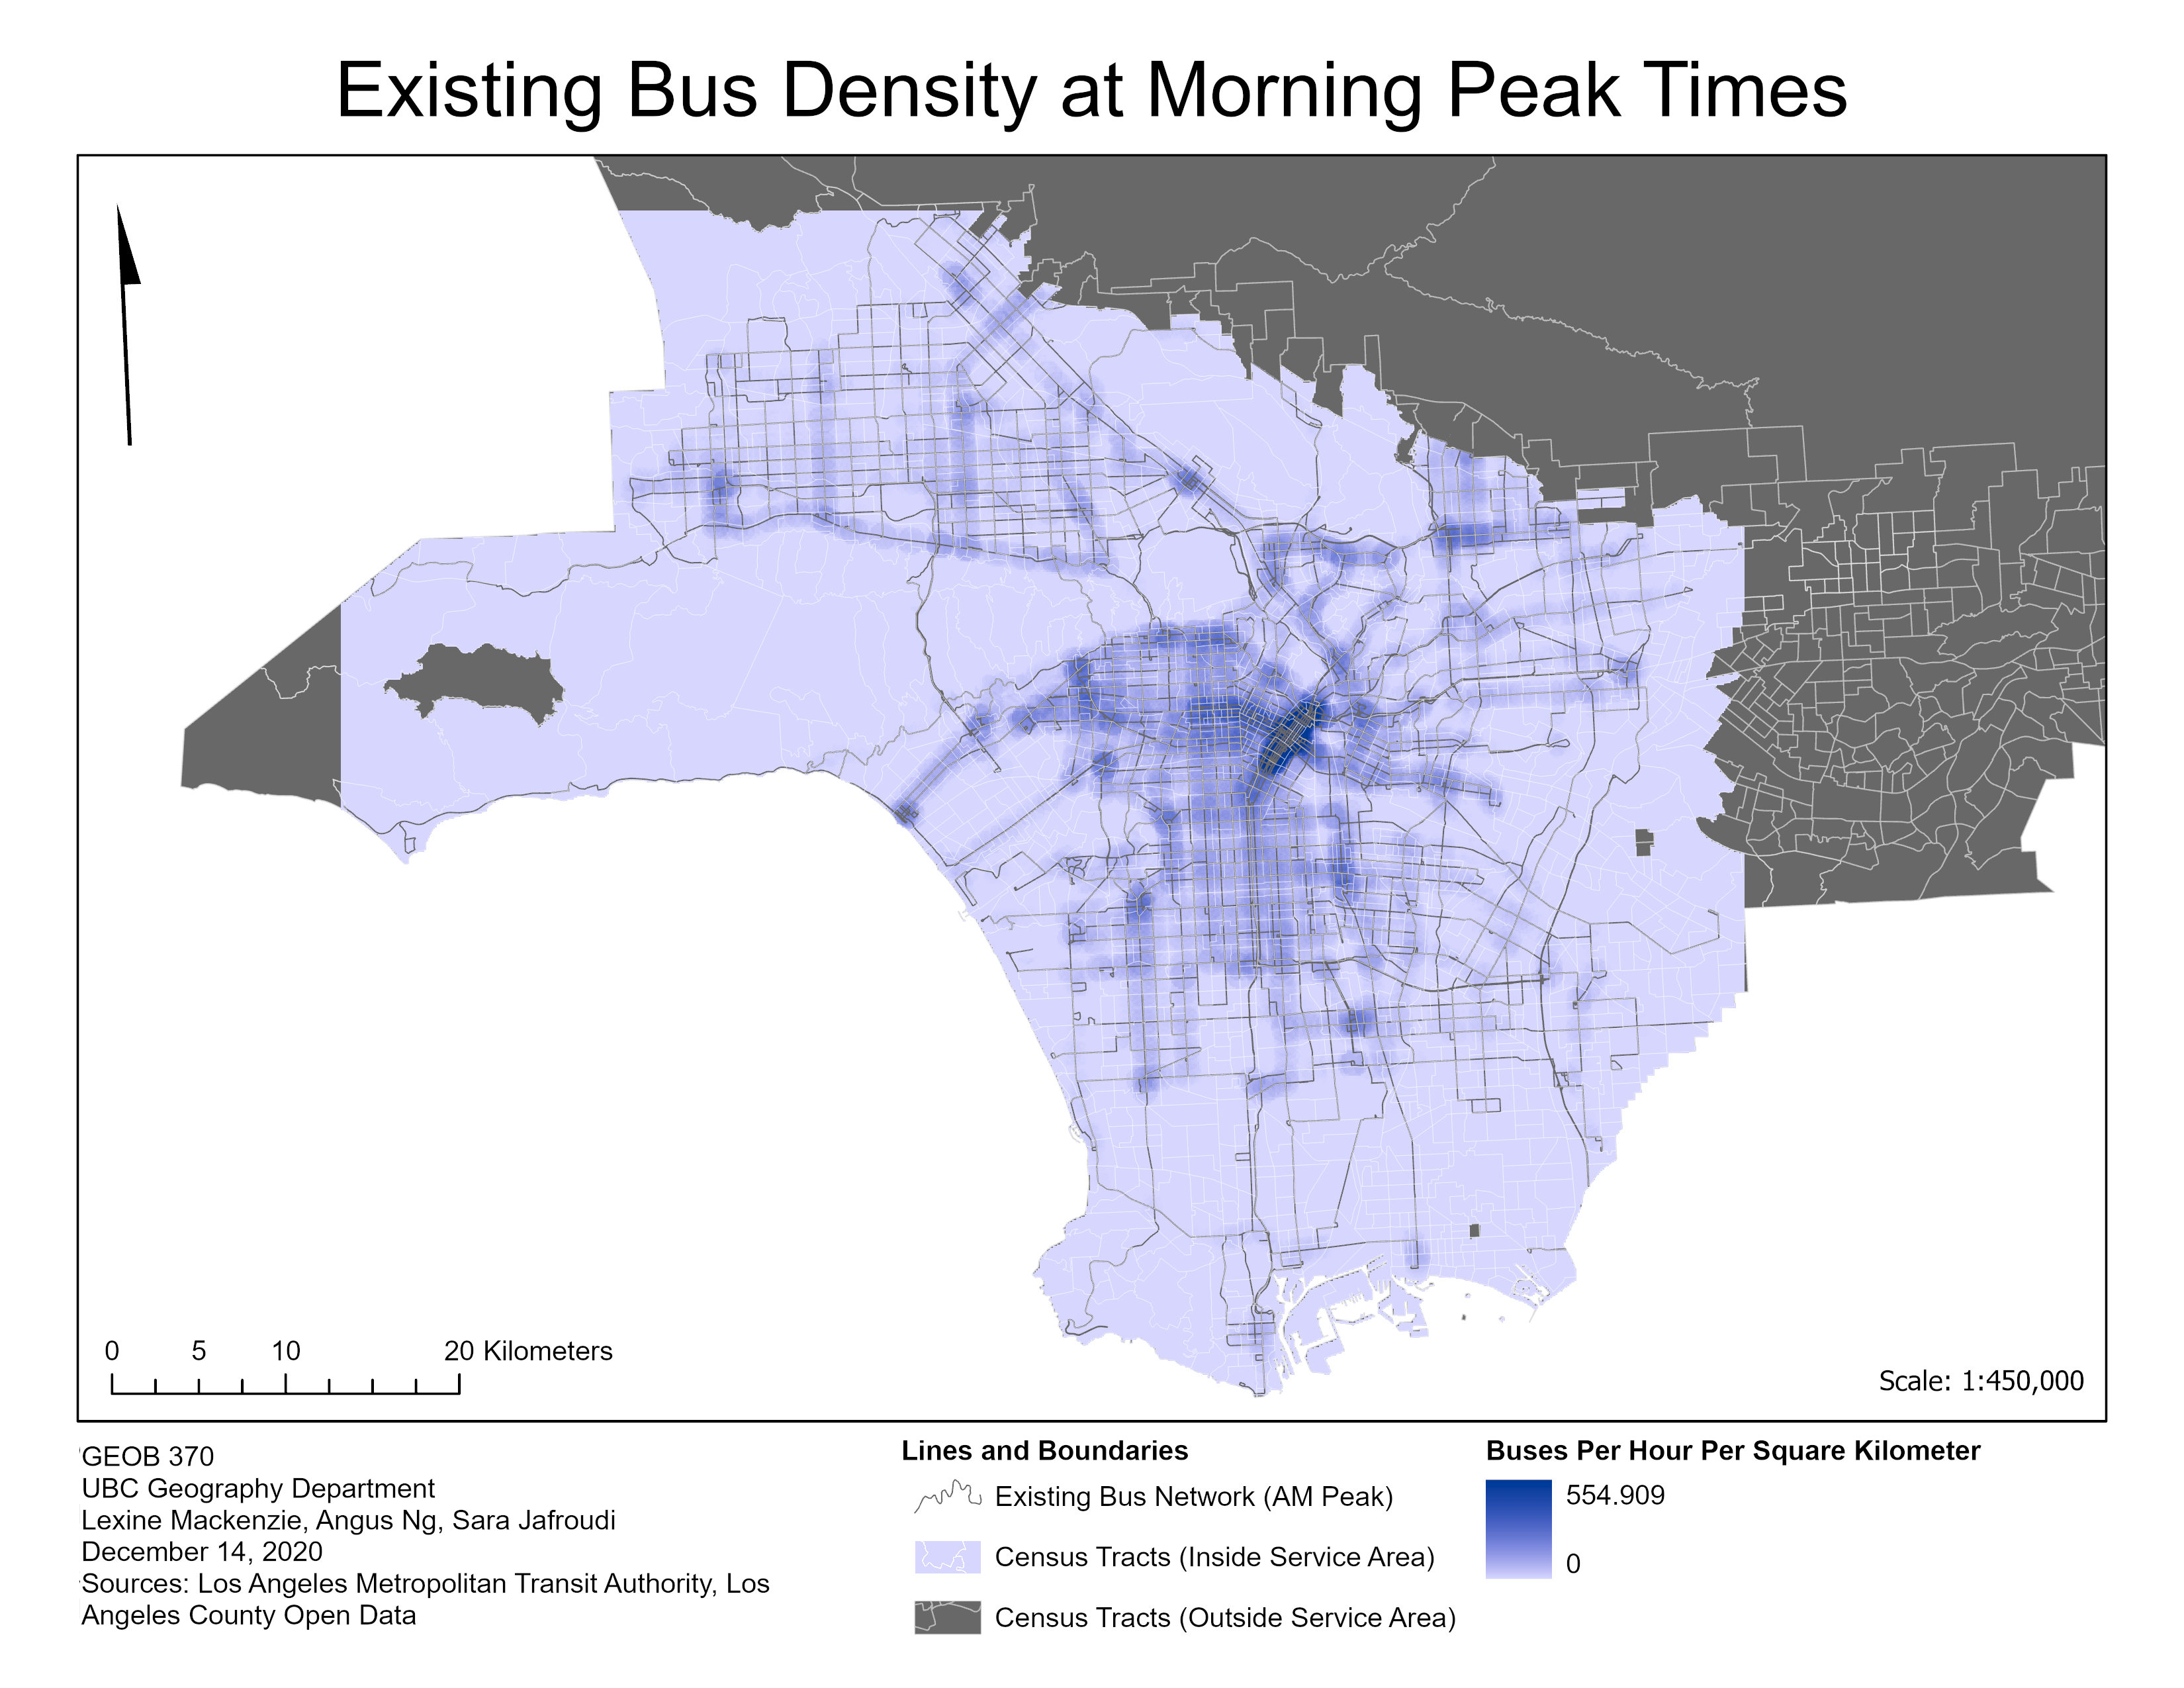
Figure 1: Bus density analysis displaying stop density weighted by buses per hour during morning peak hours
The sensitivity analysis showed visibly similar results between Equal Weighting and AHP suitability maps (Figure 2). Though internal factors were favored in the AHP weighting scheme, the distribution of regions seemed to be concentrated in similar areas for both outputs. This could be attributed to the distribution of universal constraints such as regional parks, no data zones (i.e., airports) and the correlative effect of densely populated districts located in the central downtown region. The equal weighting suitability map shows a greater amount of mid-range suitability values whereas the weighted model shows a distinct contrast between high and low values, with only a few areas with mid-range values. From an observational standpoint, the equal weighting MCE method seems to favor areas to the east of Los Angeles such as the Gateway Cities and San Gabriel Valley. In the AHP MCE method, a slightly greater preference is granted to the San Fernando Valley. One possible cause of this difference could be greater bus density values in the San Fernando region which are weighed with less importance in the equal weighting evaluation.
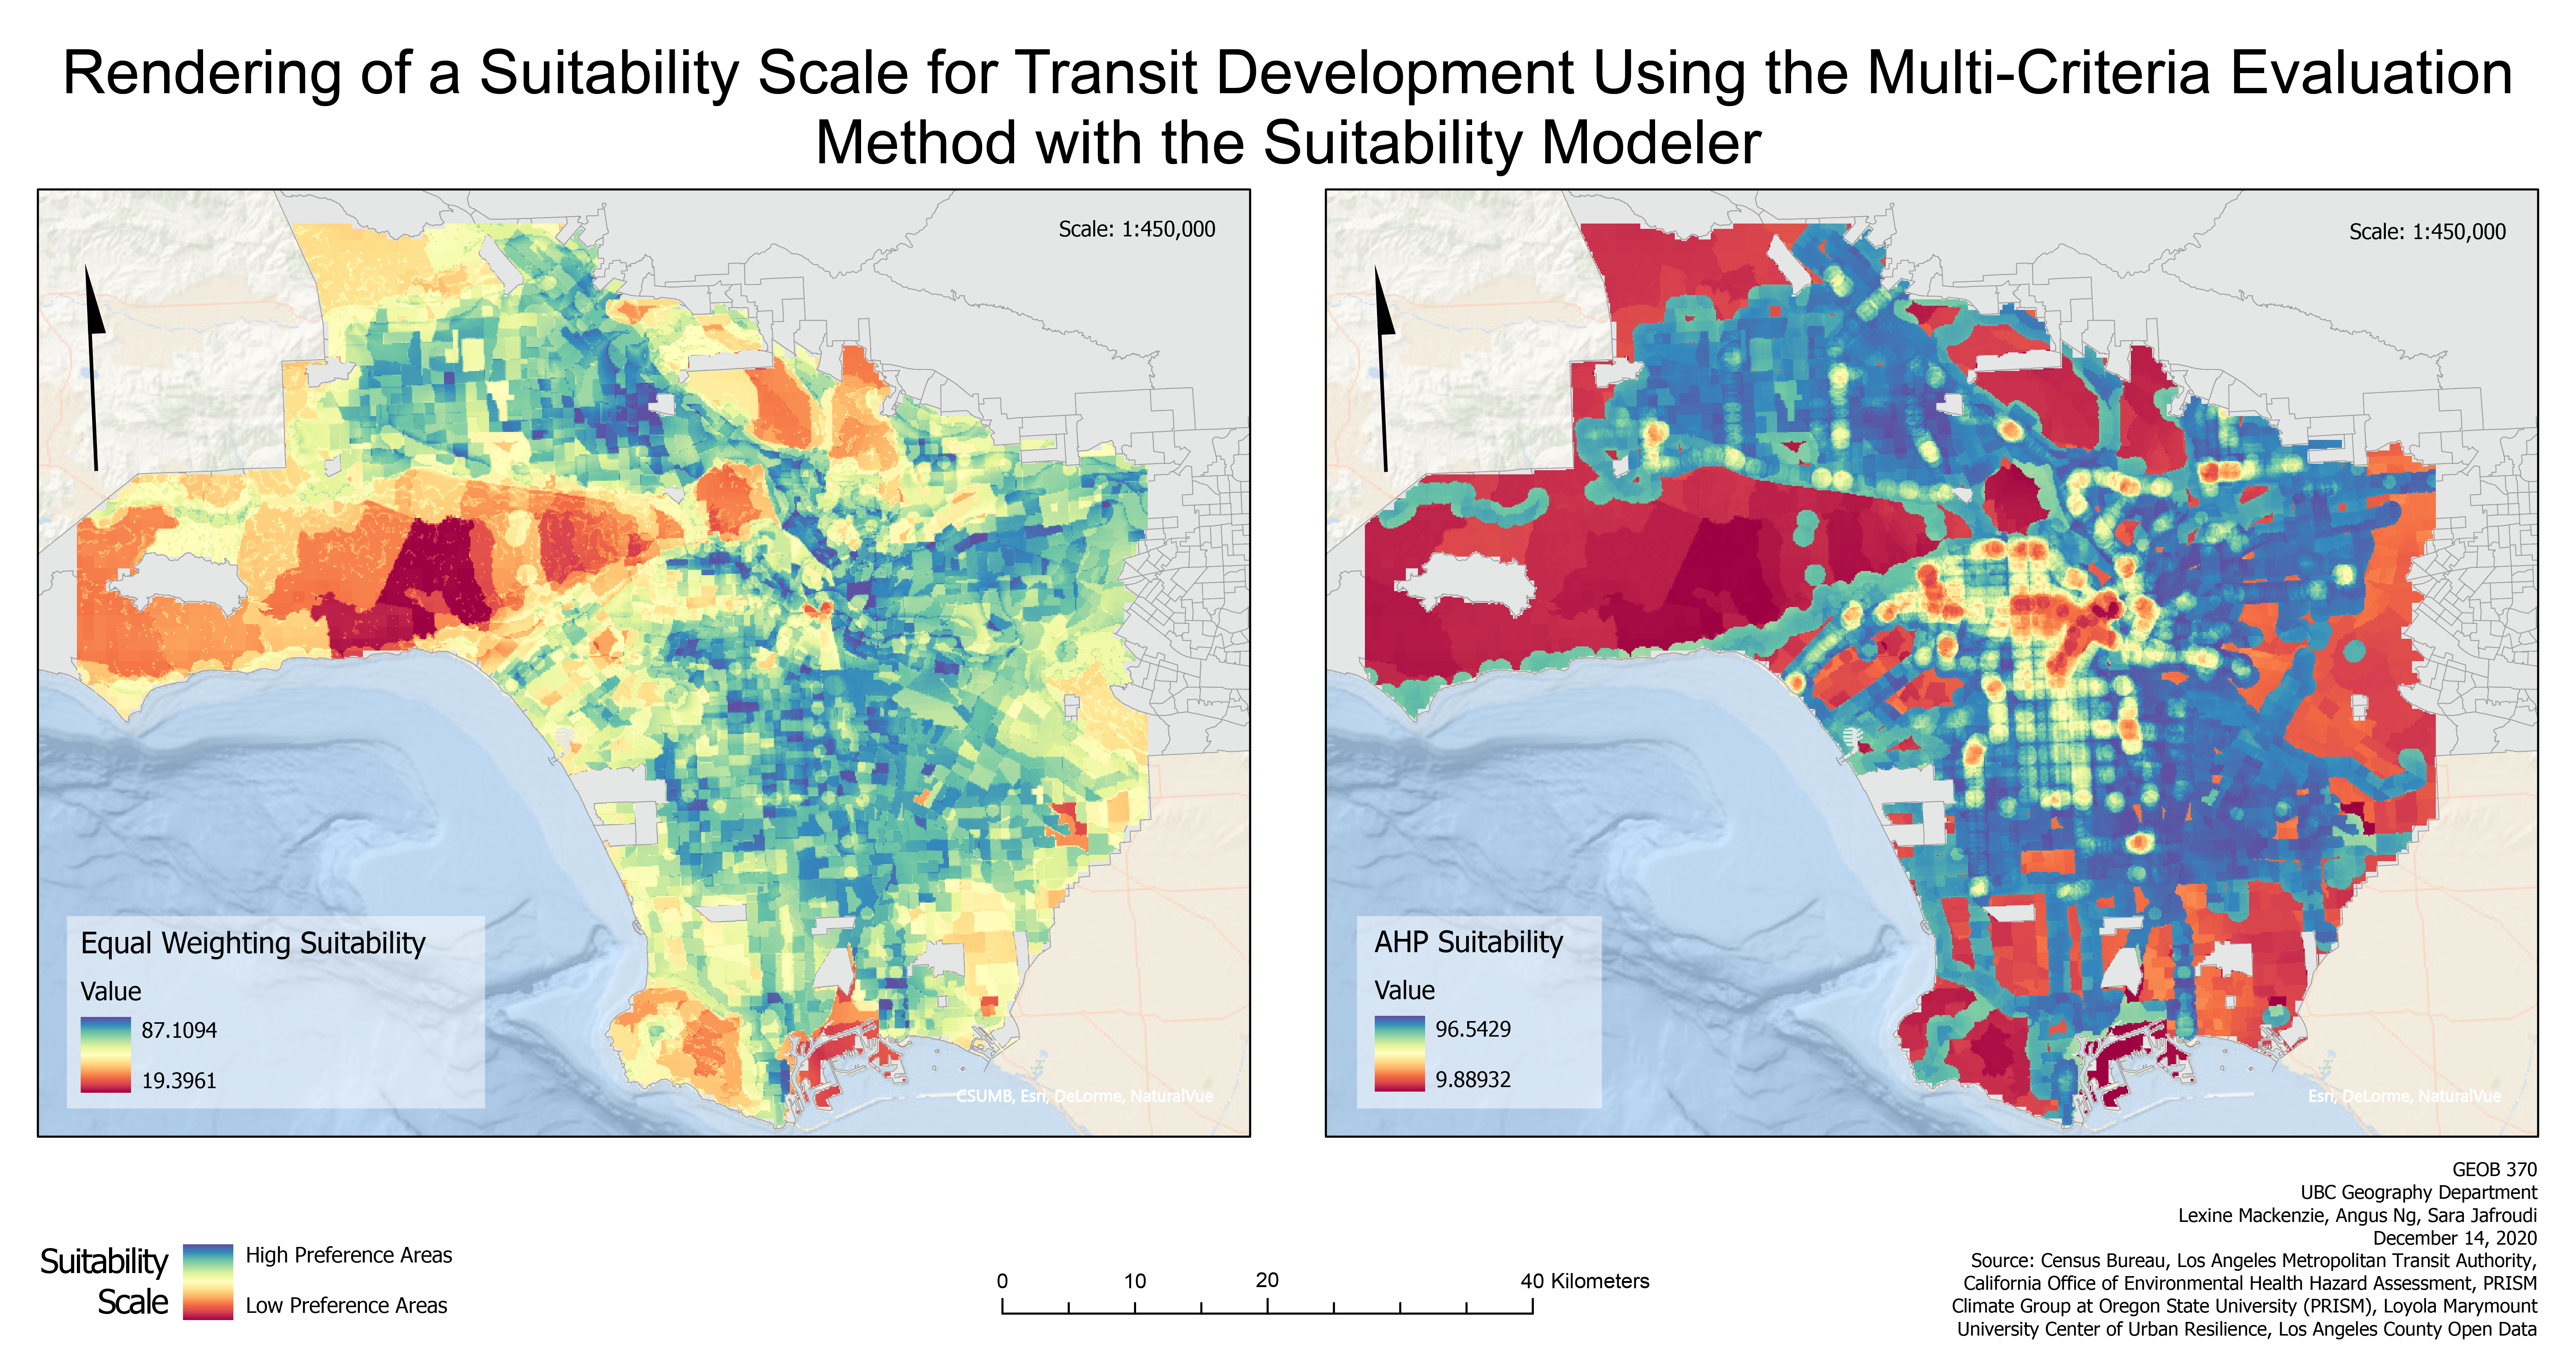
Figure 2: Side by side maps of equal weighting and AHP weighted suitability maps
The sensitivity analysis provided a quantitative means for comparing the similarities and differences between the two weighting schemes and assessing the influence of subjective weighting. A comparison of the two final region maps (Figure 3) shows an overlap in identified regions of approximately 31% between our AHP weighted model and our equal weighting model. The locational distribution of identified regions remains quite similar. However, the equally weighted regions map has a greater concentration of regions in closer proximity of one another in the east. The overlapping regions occur in the eastern and northern regions of the project area (Figure 4).
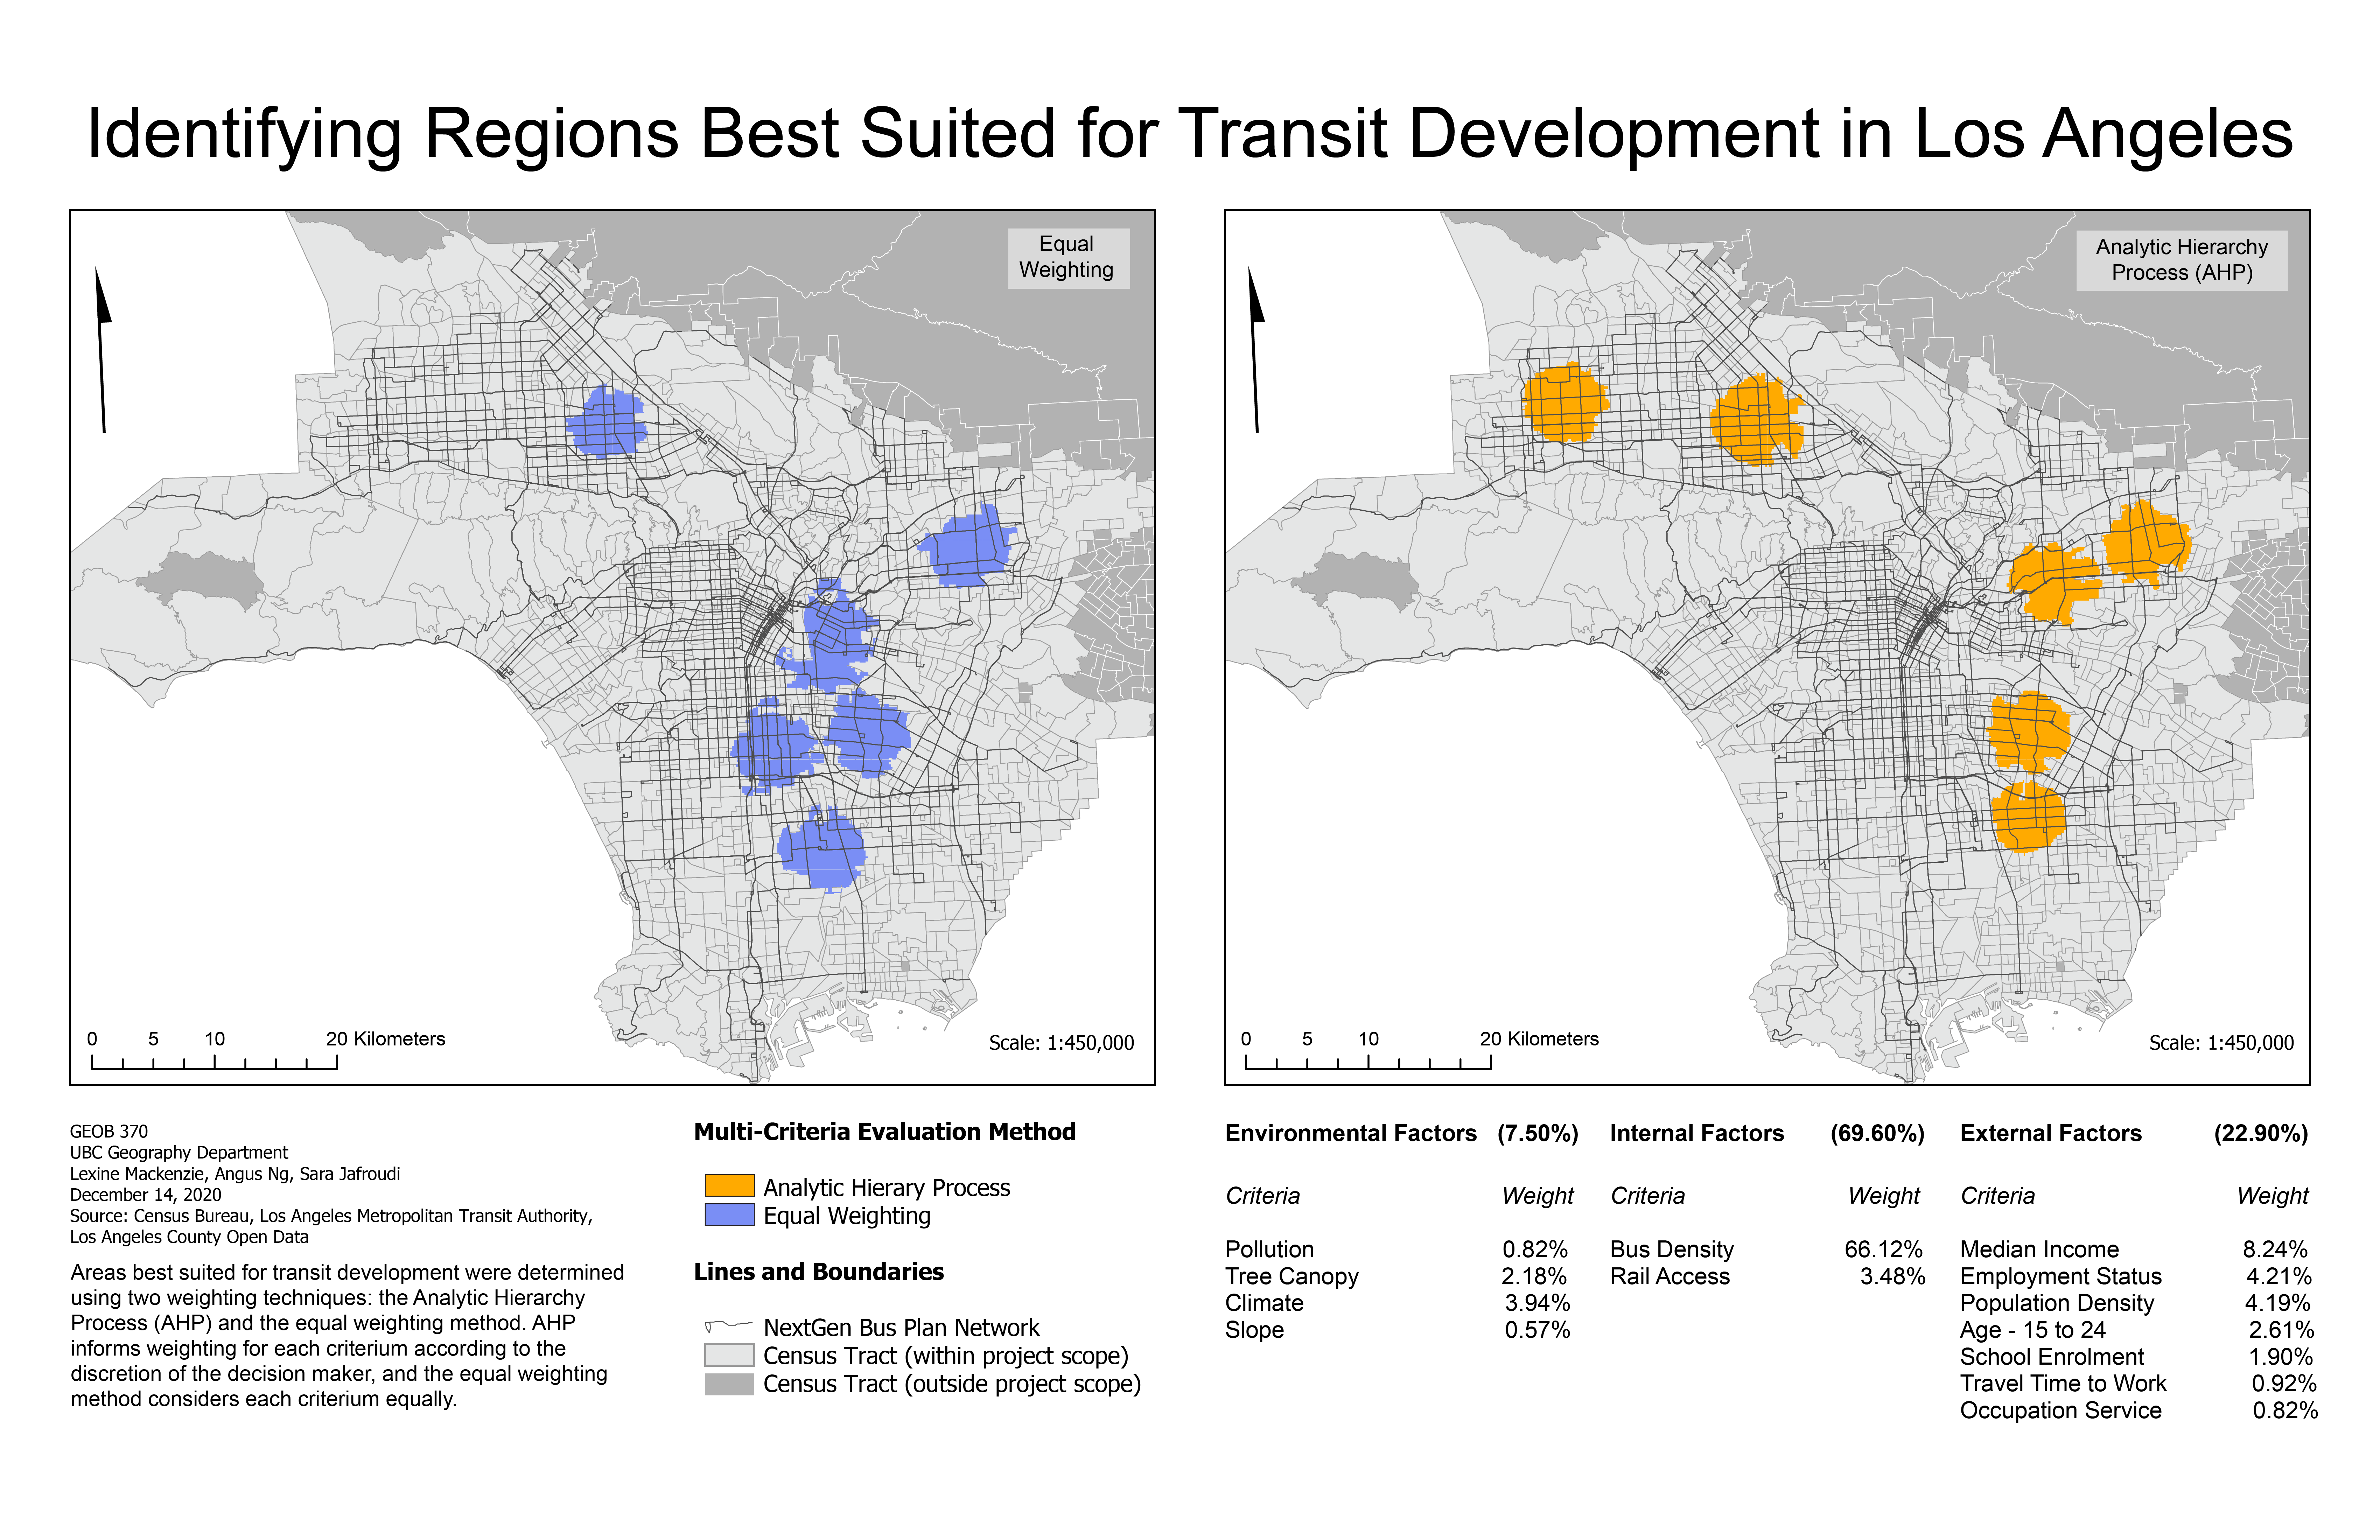
Figure 3: Side by side maps of regions identified through AHP-weighted MCE and regions using equal weighting distribution
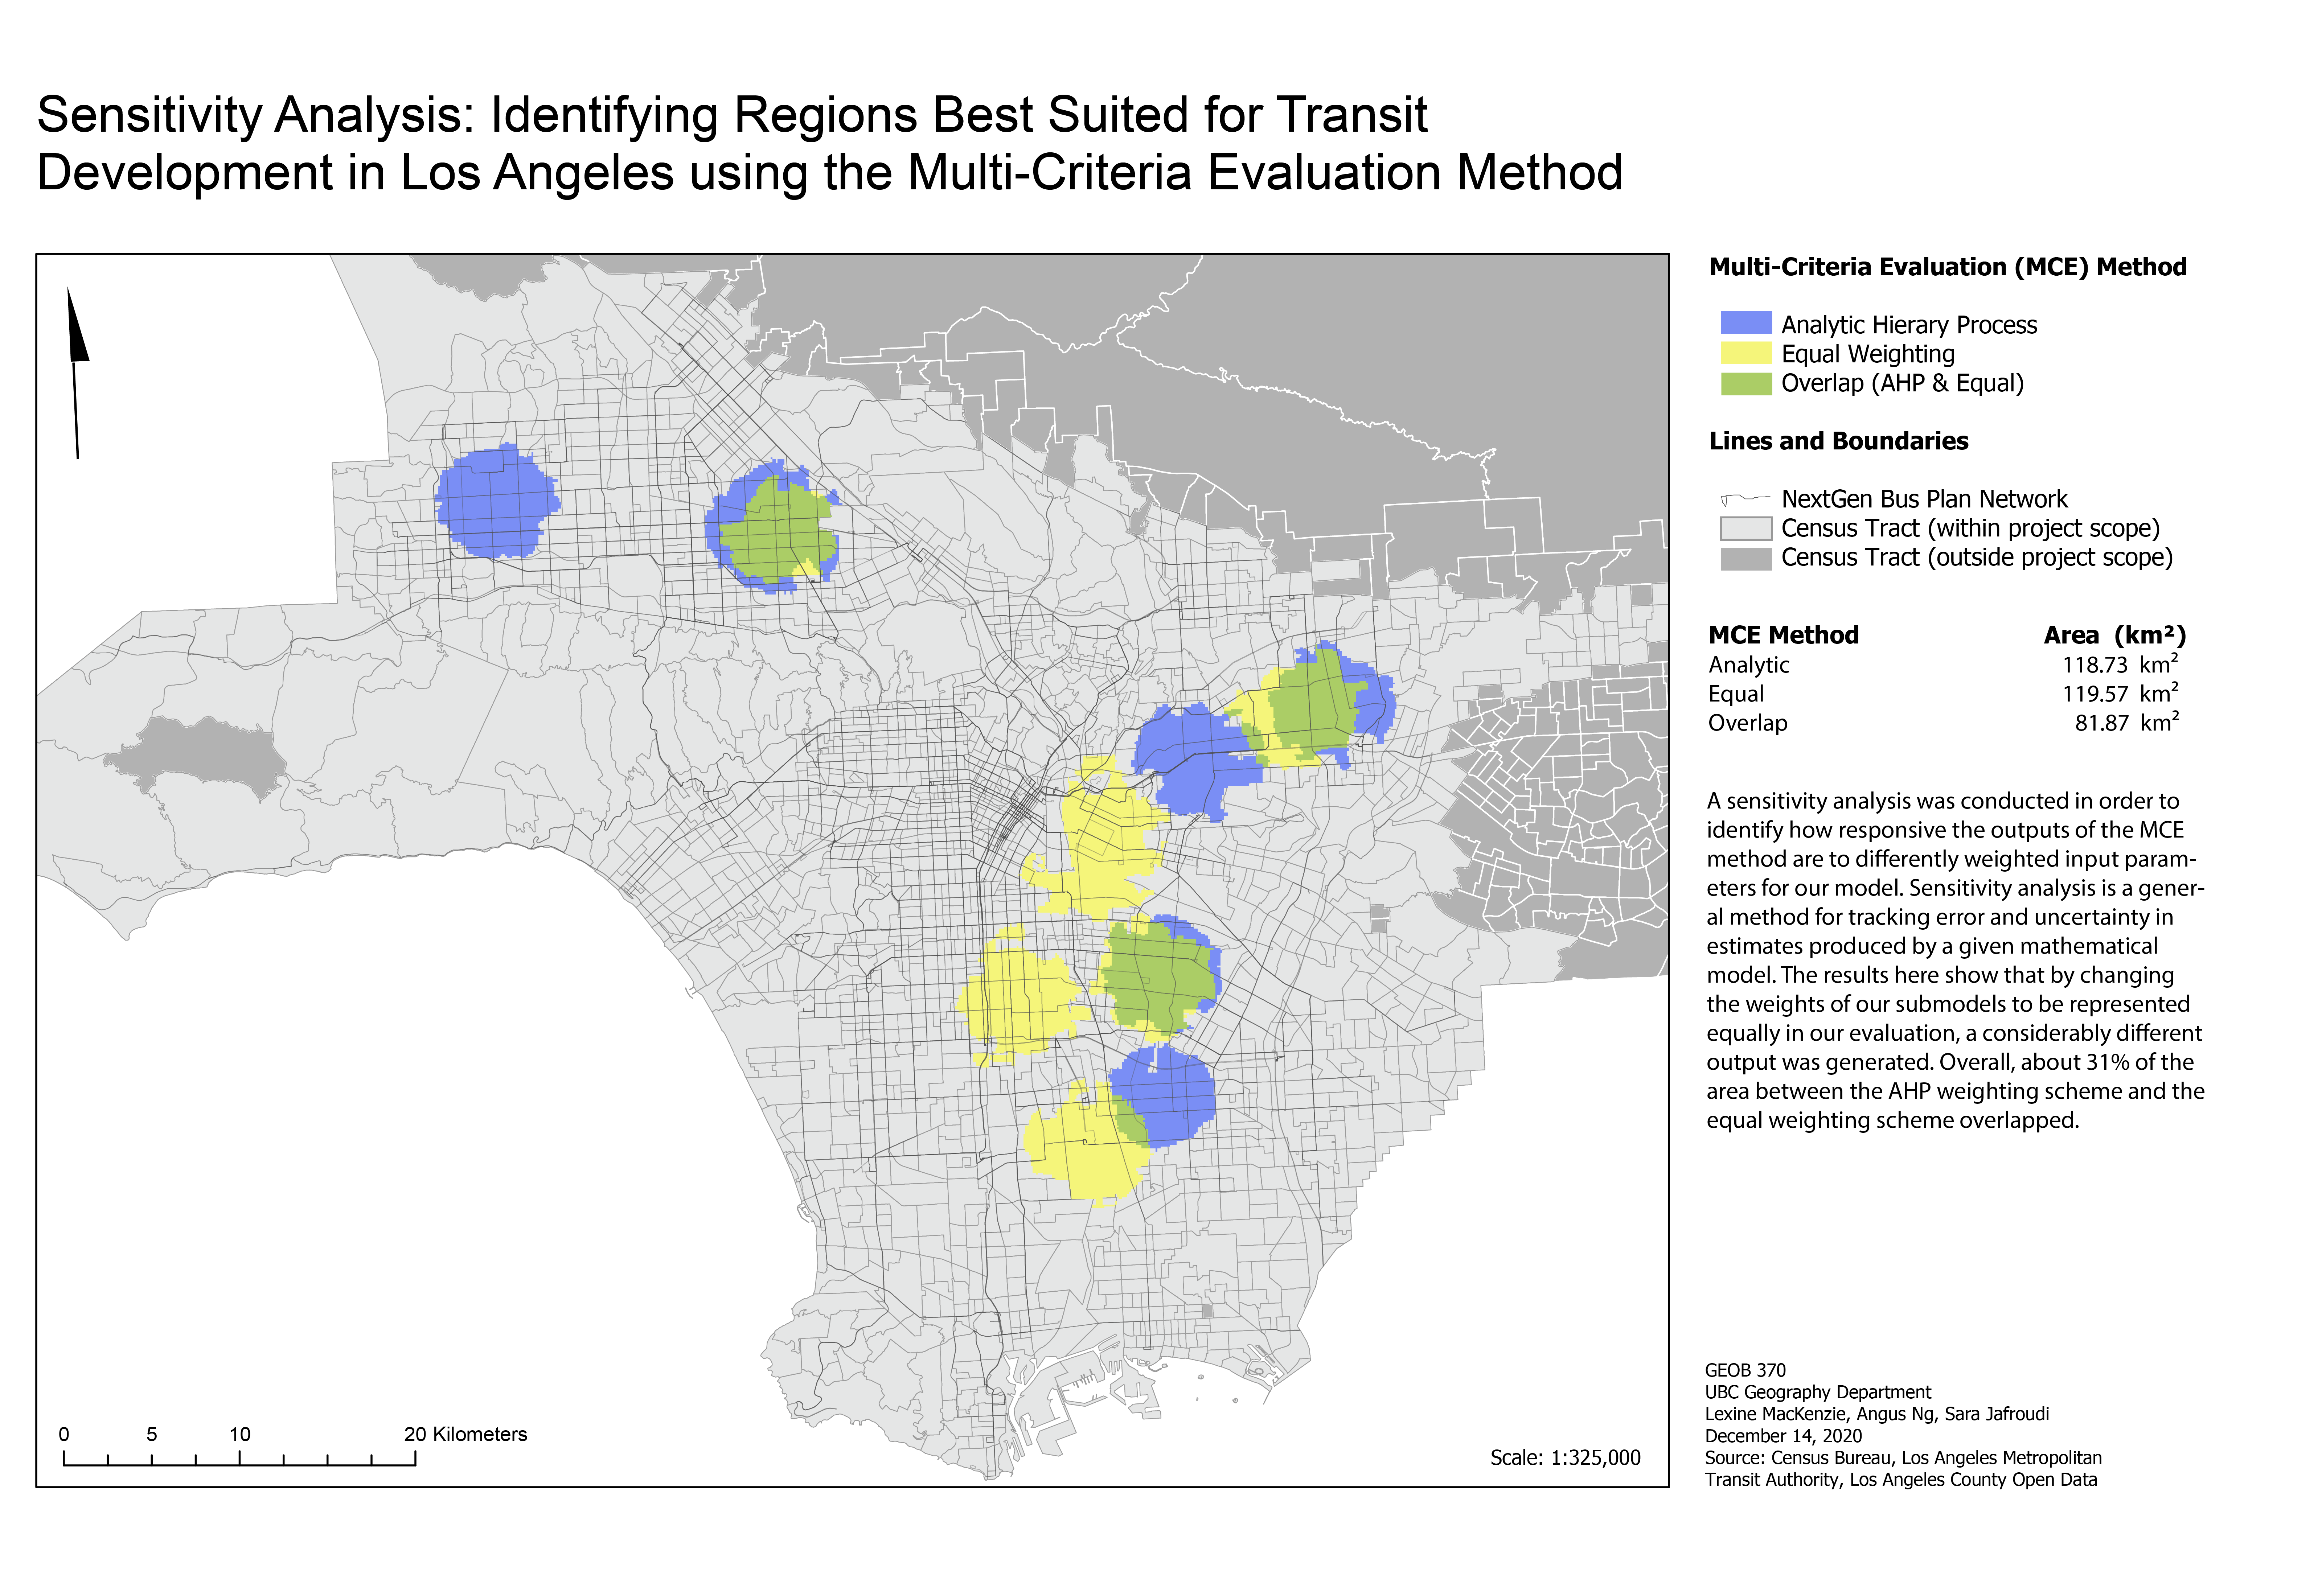
Figure 4: Comparison map of NextGen growth areas and suitability modeler-identified transit development regions
Finally, our comparison map overlapping our MCE-identified transit development regions and the NextGen growth regions shows an approximately 23% overlap of NextGen growth areas and identified suitable regions. The NextGen growth areas show expansions of bus service in close proximity to regions we identified as suitable, particularly in the east where there is the most overlap.
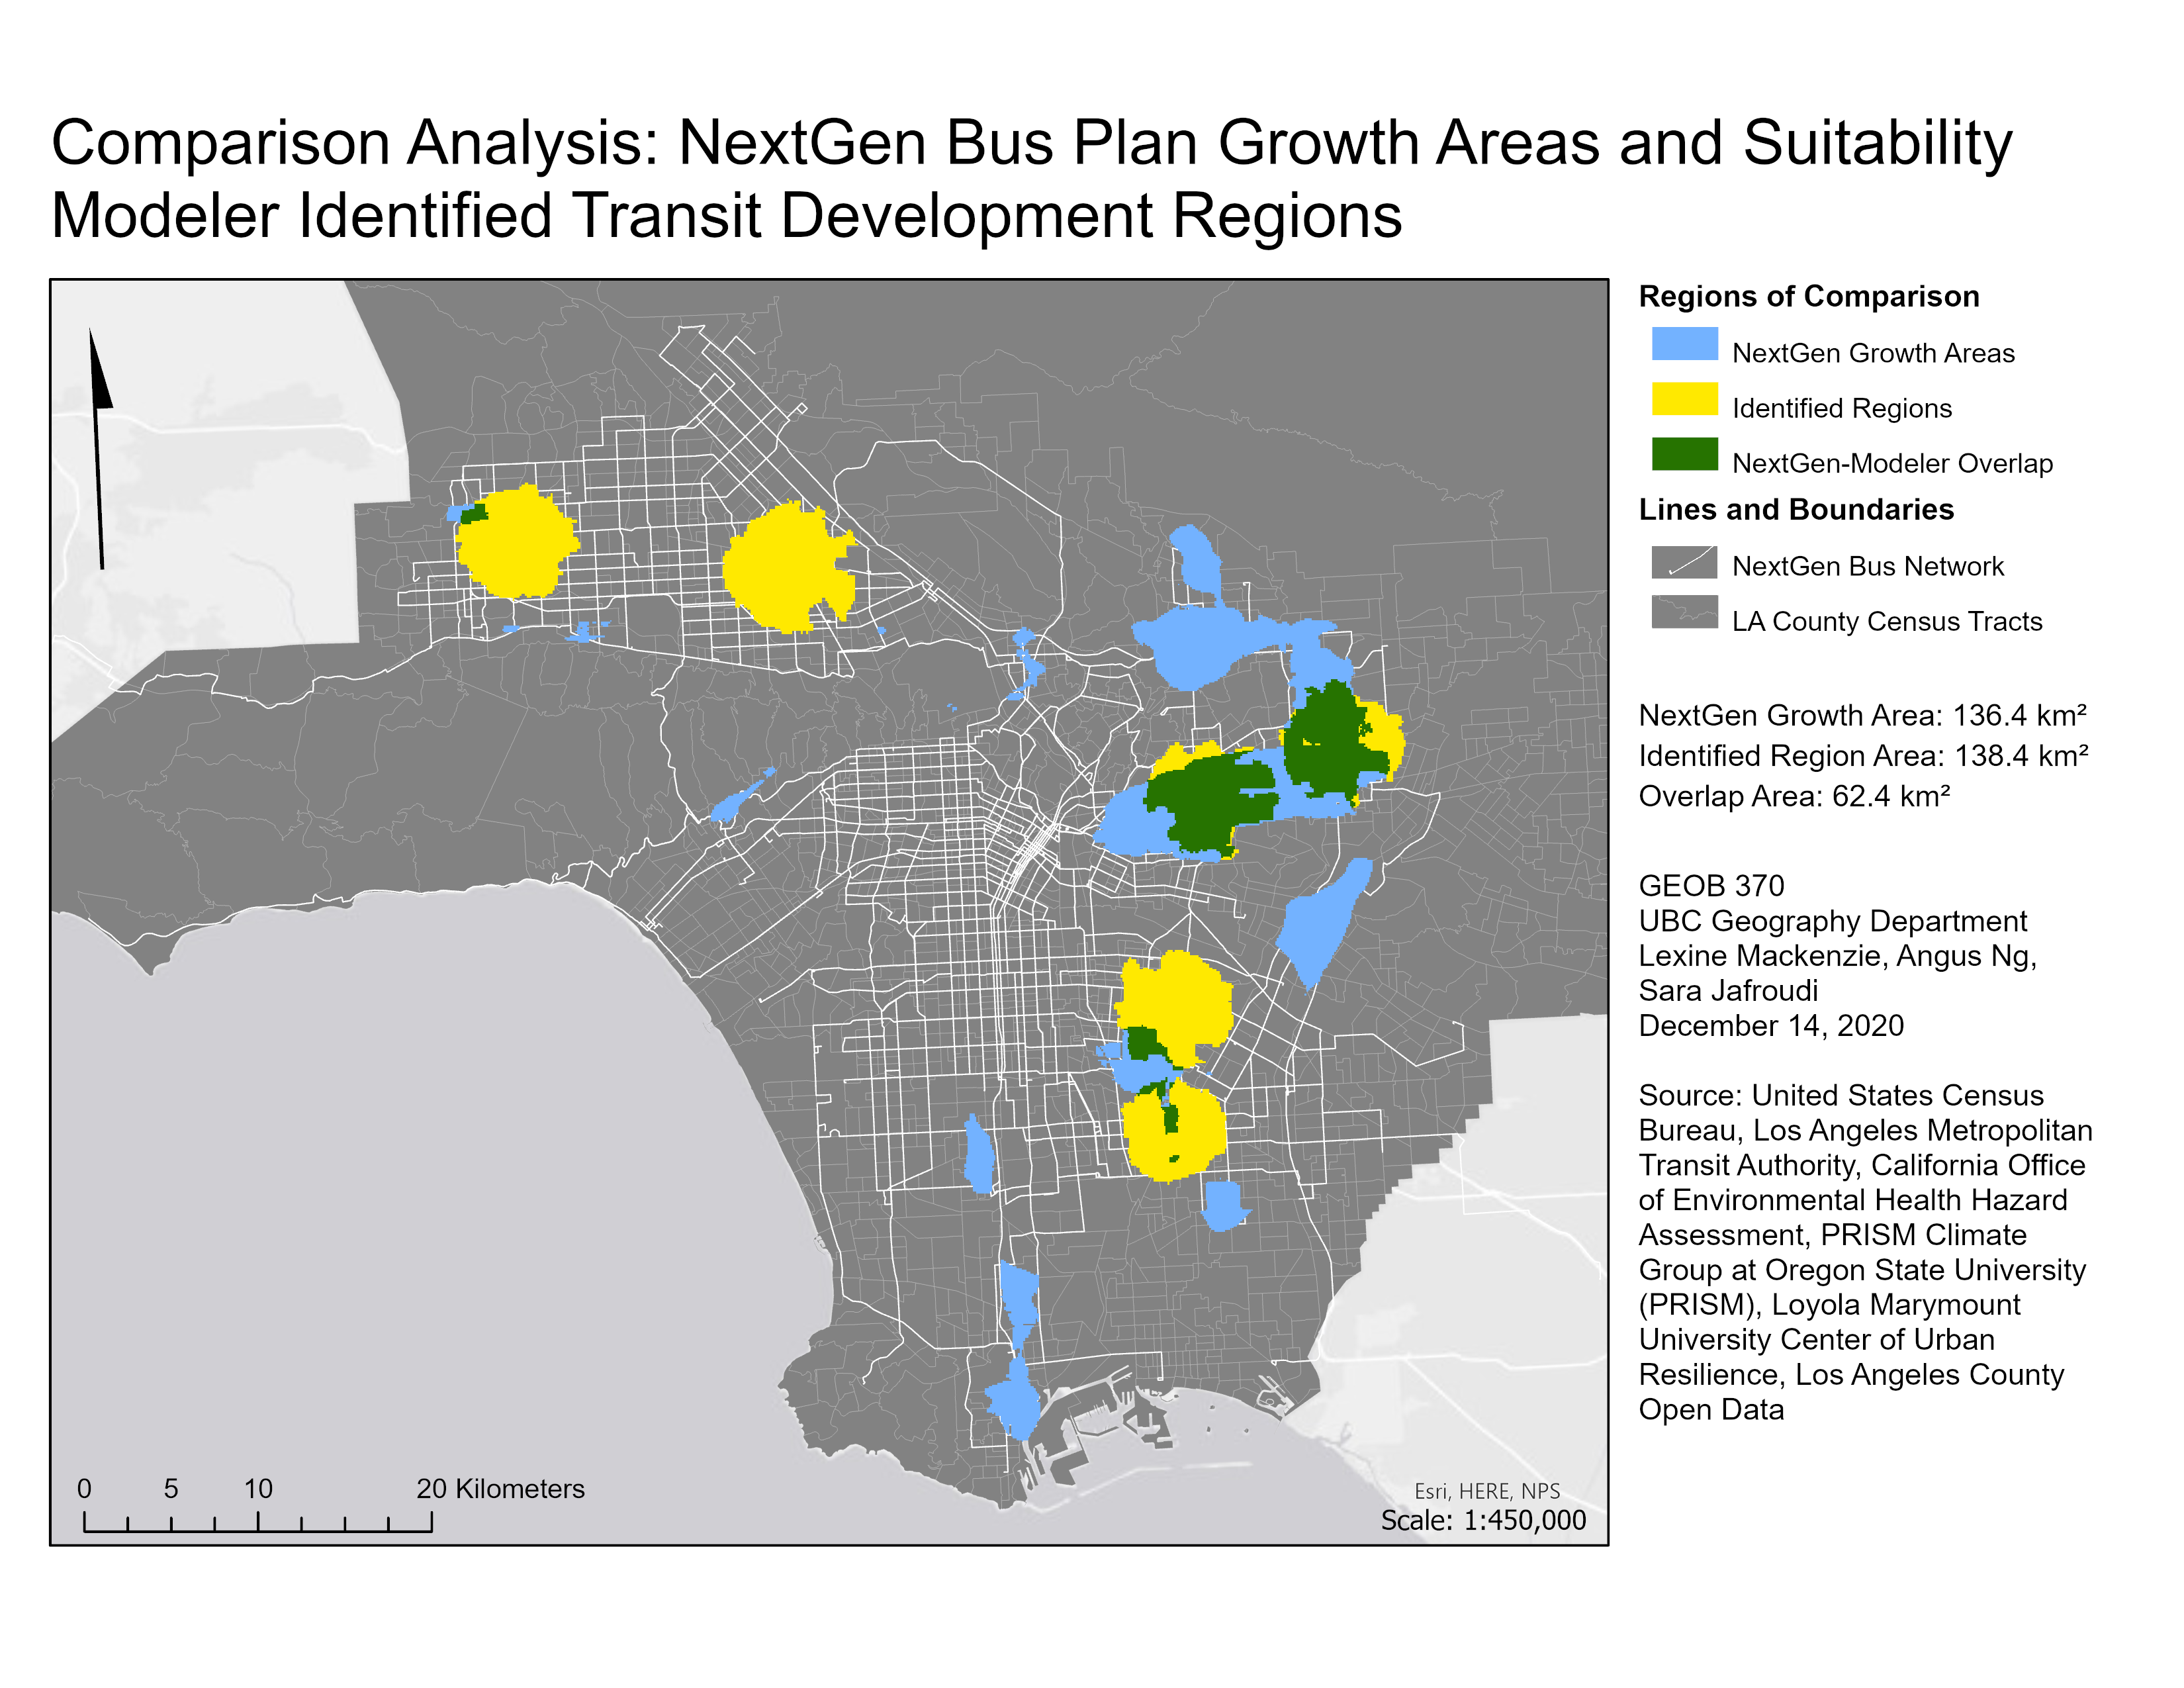
Figure 5: Comparison map of NextGen growth areas and suitability modeler-identified transit development regions